What Is Infrastructure Observability? A 2026 Guide
What infrastructure observability is, how it differs from monitoring, the core signals (metrics, logs, traces), and how to implement it without drowning in data.
- #observability
- #monitoring
- #opentelemetry
- #sre
- #devops

Infrastructure observability is the ability to understand the internal state of your IT systems by analyzing the telemetry data they generate, specifically metrics, logs, and traces. Where traditional monitoring tells you something is broken, observability tells you why it broke and where. For IT teams managing distributed cloud environments, Kubernetes clusters, or hybrid infrastructure, that distinction is the difference between a 10-minute fix and a 4-hour war room. This guide breaks down the core components, the real gap between observability and monitoring, and how to implement it without drowning in data.
What is infrastructure observability and why does it matter?
Infrastructure observability is the practice of correlating telemetry signals across metrics, logs, and traces to build a complete, queryable picture of system behavior. The term comes from control theory, where a system is “observable” if you can determine its internal state from its external outputs. In IT, that means your infrastructure must be instrumented to emit enough detail that you can answer arbitrary questions about its behavior, not just the ones you thought to ask in advance.
This matters most in cloud-native and distributed environments. A monolithic app on a single server is relatively easy to monitor with a few dashboards. A microservices application spread across 50 Kubernetes pods, three cloud providers, and a CDN is not. Observability gives you the architectural foundation to diagnose those environments without guessing.
The three primary signals are metrics (numeric time-series data like CPU usage or request rate), logs (timestamped event records), and traces (end-to-end request paths across services). Each signal answers a different question. Metrics reveal symptoms, logs explain causes, and traces pinpoint bottlenecks across service boundaries. The power of observability comes from unifying all three.

What are the core components and signals of observability?
The “three pillars” model is foundational, but it is insufficient on its own. Collecting metrics, logs, and traces in separate silos gives you data. Correlating them in a unified backend gives you observability. The difference is context: knowing that CPU spiked at 14:32 is useful, but knowing it spiked because a specific trace showed a downstream database timeout is actionable.
| Signal | What it captures | Primary use |
|---|---|---|
| Metrics | Numeric time-series (CPU, latency, error rate) | Alerting, trending, capacity planning |
| Logs | Timestamped event records with context | Root cause analysis, audit trails |
| Traces | End-to-end request paths across services | Bottleneck identification, dependency mapping |
| Events | Discrete state changes (deploys, config changes) | Correlation with incidents |
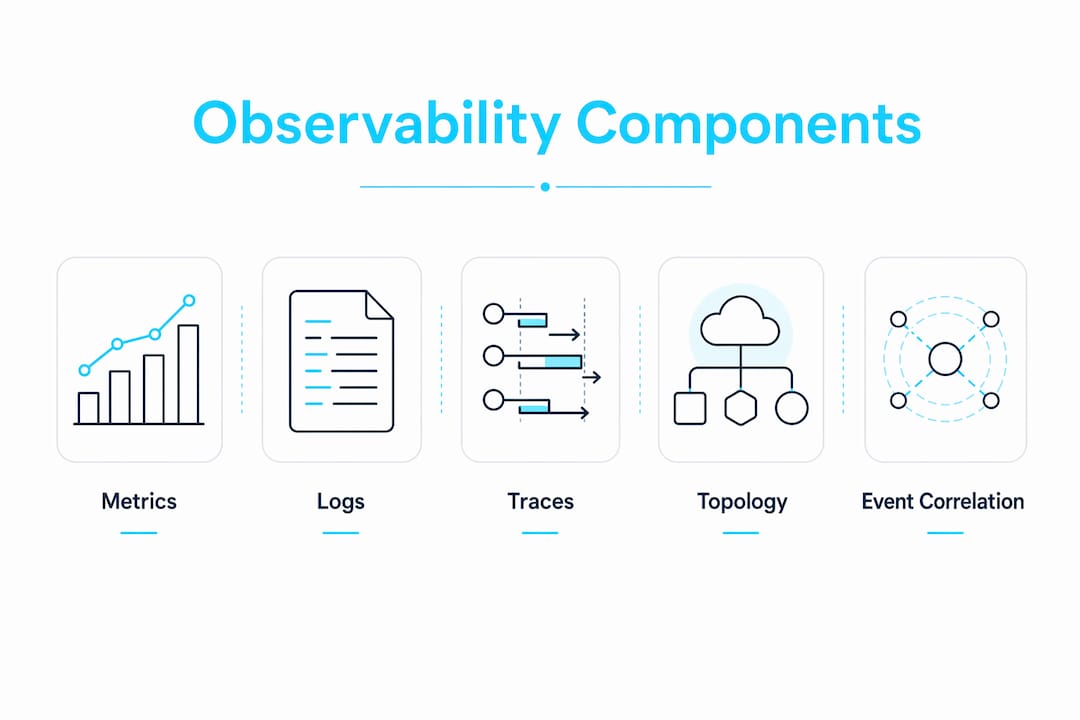
| Topology | Service dependency maps | Impact analysis, blast radius estimation |
Modern observability platforms like Dynatrace, Grafana, and the OpenTelemetry ecosystem add topology context and event correlation on top of the three pillars. OpenTelemetry, in particular, has become the de facto standard for vendor-neutral instrumentation across languages and frameworks.
Pro Tip: Start instrumentation at the service boundary first. Getting traces right across your API layer gives you more diagnostic value per hour of work than instrumenting every internal function call.
Architectural instrumentation is the part most teams underestimate. Observability requires proper instrumentation that emits high-cardinality telemetry, meaning data with enough dimensions to filter and query flexibly. Buying a platform without redesigning your instrumentation is like buying a race car and leaving it on flat tires.
How does observability differ from traditional infrastructure monitoring?
Traditional monitoring focuses on predefined dashboards and threshold-based alerts to detect what is happening. Observability correlates metrics, logs, and traces to explain why issues occur. That is not a subtle distinction. It changes how you design your systems, how you staff your on-call rotations, and how fast you recover.
Here is a concrete example. Your monitoring system fires a “high latency” alert at 2 AM. That tells you something is slow. Your observability platform shows you that the latency spike correlates with a specific trace ID, which maps to a single downstream PostgreSQL query, which started degrading after a schema migration deployed at 1:47 AM. Monitoring woke you up. Observability told you what to fix before you finished your coffee.
Key differences between monitoring and observability:
- Scope of questions. Monitoring answers questions you defined in advance. Observability lets you ask questions you never anticipated.
- Data correlation. Monitoring treats metrics, logs, and alerts as separate streams. Observability unifies them with shared context like trace IDs and deployment markers.
- Dynamic environments. Monitoring struggles with ephemeral infrastructure like Kubernetes pods or serverless functions. Observability tracks state across short-lived entities.
- Root cause depth. Monitoring identifies the symptom. Observability traces the causal chain back to the source.
- Proactive vs. reactive. Monitoring is reactive by design. Observability supports proactive detection through anomaly scoring and baseline deviation.
Pro Tip: Do not throw away your monitoring setup when you adopt observability. Alerts and dashboards are still the fastest way to detect known failure modes. Observability handles the unknowns.
Monitoring and observability are complementary, not competing. The teams that get the most value treat monitoring as the detection layer and observability as the diagnosis layer. If you want a faster way to write the alert rules that power that detection layer, the free Monitoring & Alert-Rule Generator turns a plain-language description into reviewable Prometheus rules.
What are the benefits and business impacts of implementing observability?
The operational numbers are hard to ignore. Intelligent observability can reduce major outages by up to 60% and improve mean time to recovery (MTTR) by as much as 90%. A 90% MTTR improvement on a system that previously took 2 hours to recover means your next incident resolves in about 12 minutes. That is the kind of change that shows up in SLA reports and customer satisfaction scores.
AI-powered platforms take this further. Auto-remediation workflows can resolve common infrastructure incidents in milliseconds, with no human in the loop, for well-defined incident classes like pod restarts, disk pressure events, and certificate expirations.
The benefits extend well beyond ops teams. Mature observability practices speed up debugging and increase deployment confidence for engineers. Developers who can see exactly how their code behaves in production ship faster and break less. That is a direct productivity multiplier across your entire engineering organization.
Observability also connects technical performance to business outcomes. Correlating telemetry with SLIs lets you link service latency directly to customer retention and conversion rates. When your VP of Engineering can show the CFO that a 200ms latency improvement correlates with a 3% increase in checkout completion, observability stops being a cost center and becomes a revenue argument.
How to implement infrastructure observability effectively
The biggest mistake I see teams make is treating observability as a tooling purchase. Observability is an architectural property. It requires your systems to be designed and instrumented to emit the right telemetry. No platform fixes bad instrumentation.
A practical implementation sequence:
- Instrument at the boundary first. Add OpenTelemetry tracing to your API gateways and service entry points before going deeper. This gives you the highest-value signal fastest.
- Unify your telemetry backend. Separate tools for metrics (Prometheus), logs (Loki or Elasticsearch), and traces (Jaeger or Tempo) work, but a unified backend like Grafana’s LGTM stack or Dynatrace reduces correlation friction significantly.
- Define your SLIs and SLOs before you build dashboards. Dashboards built without SLOs become noise generators. Know what “good” looks like before you start measuring.
- Apply data governance from day one. Excessive telemetry without governance creates observability debt. Costs spike, queries slow down, and signal drowns in noise. Use smart sampling, retention tiers, and cardinality limits.
- Layer in AI-driven correlation. Once your telemetry is clean, platforms with AI-powered anomaly detection and root cause analysis pay for themselves quickly.
Pro Tip: Use confidence-gated auto-remediation patterns when connecting observability to automated fixes. High-confidence, low-risk actions like restarting a pod can run automatically. Low-confidence or high-impact actions should still require human approval.
For Kubernetes environments specifically, AI-assisted troubleshooting built on top of observability data cuts diagnosis time dramatically — see AI workflows for Kubernetes cluster troubleshooting for the full workflow.
What are the use cases and future trends in observability?
Observability is not a single-team concern. It supports SRE, DevOps, platform engineering, and increasingly, business intelligence functions. Unified observability across hosts, networks, and cloud services accelerates cloud transformation by giving migration teams real-time visibility into hybrid environments during cutover.
| Use case | Observability capability | Business outcome |
|---|---|---|
| Cloud migration | Unified multi-cloud telemetry | Reduced migration risk and faster cutover |
| Incident response | AI-driven root cause analysis | Faster MTTR, fewer escalations |
| Capacity planning | Predictive anomaly detection | Lower cloud spend, fewer surprise outages |
| Self-healing infrastructure | Auto-remediation workflows | Reduced on-call burden |
| Developer productivity | Trace-driven debugging | Faster releases, higher deployment confidence |
AI-driven predictive anomaly detection and capacity intelligence are the fastest-moving area in the space right now. Platforms are moving from reactive correlation to proactive forecasting, flagging resource exhaustion or degradation patterns hours before they cause user impact. For teams running self-healing infrastructure, this is the foundation that makes autonomous remediation safe and reliable.
Open-source tooling like OpenTelemetry, Prometheus, Grafana, and Tempo gives smaller teams enterprise-grade observability without enterprise-grade licensing costs. The ecosystem has matured enough that a well-instrumented open-source stack is genuinely competitive with commercial platforms for most use cases.
Key Takeaways
Infrastructure observability delivers real operational value only when instrumentation, data governance, and AI-driven correlation are treated as architectural disciplines, not afterthoughts.
| Point | Details |
|---|---|
| Observability vs. monitoring | Monitoring detects what is broken; observability explains why, using correlated metrics, logs, and traces. |
| Three pillars plus correlation | Metrics, logs, and traces only create observability value when unified in a shared backend with context. |
| MTTR improvement | Intelligent observability can reduce outages by 60% and improve MTTR by up to 90%. |
| Instrumentation first | Buying a platform without redesigning instrumentation does not create observability. |
| Governance prevents debt | Collecting excessive telemetry without retention policies creates cost and query performance problems. |
Why I think most teams are implementing observability backwards
I have watched a lot of teams buy Datadog, Dynatrace, or a Grafana stack and then wonder why their on-call load did not drop. The tool was not the problem. The instrumentation was. They were feeding a powerful correlation engine with low-cardinality, poorly structured telemetry and expecting magic.
The uncomfortable truth is that observability is an organizational discipline before it is a technical one. SRE, DevOps, and platform engineering teams need to agree on what “observable” means for each service, what SLIs matter, and who owns telemetry quality. Without that alignment, you end up with 47 dashboards nobody trusts and alerts that fire on symptoms nobody can trace back to a cause.
The other trap I see is the data firehose. Teams instrument everything, ingest everything, and then spend more on storage than on the engineers who are supposed to use the data. Focused, actionable telemetry with intelligent tiering beats raw volume every time. Less data, better structured, with clear ownership, is worth more than a petabyte of noise.
AI-driven observability is a genuine force multiplier, but only on a clean foundation. Get your instrumentation right, define your SLOs, and then let the AI layer do what it does well: surface patterns you would never find manually. The teams I have seen get the most value from observability treat it as a continuous improvement practice, not a one-time deployment.
— James
Take your observability further with DevOps AI ToolKit
If you are ready to move from theory to working infrastructure, DevOps AI ToolKit has the workflows to get you there faster. The prompt library and packs cover observability automation, incident response, and auto-remediation patterns you can drop into your existing stack. If you are building out your logging and alerting layer, the Linux Admin Prompt Pack includes battle-tested prompts for structuring telemetry, writing alert rules, and diagnosing production issues faster with AI assistance. For teams looking at AI-driven incident response built on observability data, the best AI tools for incident response guide is a practical starting point.
FAQ
What is the simplest definition of infrastructure observability?
Infrastructure observability is the ability to understand the internal state of your IT systems by analyzing the telemetry they generate, specifically metrics, logs, and traces. It goes beyond alerting to explain why problems occur, not just that they exist.
How is observability different from monitoring?
Monitoring uses predefined alerts and dashboards to detect known failure conditions. Observability correlates metrics, logs, and traces to diagnose unknown or novel issues in dynamic, distributed environments.
What are the three pillars of observability?
The three pillars are metrics, logs, and traces. Metrics show numeric trends, logs capture event details, and traces map request paths across services. Real observability value comes from correlating all three in a unified backend.
What tools are commonly used for infrastructure observability?
Common tools include Prometheus for metrics, Grafana for visualization, Loki or Elasticsearch for logs, Jaeger or Tempo for traces, and OpenTelemetry for vendor-neutral instrumentation. Commercial platforms like Dynatrace and Datadog offer unified stacks.
How long does it take to implement observability?
Basic instrumentation with OpenTelemetry and a Prometheus and Grafana stack can be operational in days for a small environment. Full observability with correlated telemetry, SLO-based alerting, and AI-driven anomaly detection typically takes weeks to months depending on environment complexity and team size.
Recommended
- Detecting and Fixing Infrastructure Config Drift
- Catching Bad Infrastructure Early With Terraform Check Blocks and Assertions
- Policy-as-Code for Infrastructure: OPA and Conftest in Practice
- Managing Secrets in Infrastructure as Code Without Leaking Them
Download the Free 500-Prompt DevOps AI Toolkit
500 battle-tested, copy-paste AI prompts engineered by a senior systems engineer — every one with fill-in placeholders and safety/back-out notes. Drop your email and it's yours.
- 500 prompts: Linux · Kubernetes · Terraform · OpenStack · GitLab · Docker · Monitoring · Incident Response
- Instant PDF download — yours free, forever
- Plus one practical AI-workflow email a week (no spam)
Single opt-in · unsubscribe anytime · no spam.