
Why Observability Differs from Monitoring: A DevOps Guide
Discover why observability differs from monitoring and how it enhances incident response. Learn to diagnose issues faster and reduce MTTR.
Monitoring tells you something is broken. Observability tells you why. That single distinction reshapes how you instrument systems, staff incidents, and reduce MTTR in cloud-native environments.
TL;DR:
- Monitoring uses predefined thresholds against metrics, logs, and alerts to detect known failure conditions. Observability uses high-cardinality telemetry (metrics, logs, traces) to diagnose unknown-unknowns through exploratory queries.
- Monitoring fires the alert. Observability answers the follow-up question your runbook never anticipated.
- MTTR drops when you can correlate a trace to the alert that triggered it, rather than guessing which service degraded first.
- If you’re running multiple services and seeing incidents your dashboards can’t explain, it’s time to invest in observability instrumentation, not just more alerts.
For incident response, this means your monitoring stack is the smoke detector and your observability stack is the forensic investigation. You need both, and they hand off to each other in a specific order.
Table of Contents
- Why observability differs from monitoring: what monitoring actually does
- The telemetry pillars: metrics, logs, traces, and events
- Where monitoring and observability share the same ground
- Key differences between observability and monitoring across concrete axes
- When monitoring is enough and when to invest in observability
- Which tools handle monitoring vs. observability in practice
- Practitioner-grade instrumentation checklist for faster MTTR
- Key Takeaways
- The gap between what observability promises and what teams actually build
- Devopsaitoolkit gives you the runbooks, prompts, and tools to act on this now
- Useful sources and further reading
Why observability differs from monitoring: what monitoring actually does
Monitoring is the practice of collecting predefined telemetry signals, comparing them against known thresholds, and triggering alerts when those thresholds are crossed. The operative word is predefined. You decide in advance what matters, what normal looks like, and what broken looks like. The system watches for those conditions and tells you when they occur.
At a technical level, a monitoring stack typically works like this: an agent or exporter scrapes metrics from your services on a fixed interval, an aggregation layer stores time-series data, alert rules evaluate that data against threshold expressions, and a notification channel fires when a rule trips. Dashboards visualize the steady state. The whole model assumes you already know what to watch.
A concrete alert definition looks like this:
alert: HighErrorRate
expr: rate(http_requests_total{status=~"5.."}[5m]) > 0.05
for: 2m
labels:
  severity: critical
annotations:
  summary: "Error rate above 5% for {{ $labels.service }}"
  runbook: "https://runbooks.internal/high-error-rate"
That rule catches a known failure mode. It does nothing for a failure mode you haven’t thought of yet.
Classic monitoring use cases include capacity planning (disk fill rate, CPU saturation), availability checks (uptime, health endpoints), SLA/KPI tracking (p99 latency against a budget), and scheduled synthetic checks. These are genuinely useful. A well-tuned monitoring setup catches the majority of production incidents in a stable, well-understood system.
The limitation surfaces in distributed systems. When a single user request fans out across a dozen microservices, a monitoring alert on service C tells you service C is slow. It tells you nothing about whether service A’s database query caused it, whether a recent deploy on service B changed call patterns, or whether a downstream dependency is the real culprit. Monitoring detects known conditions; observability lets you ask new questions and diagnose unknown-unknowns.
Monitoring is necessary. In cloud-native systems, it’s often not sufficient on its own.
The telemetry pillars: metrics, logs, traces, and events
These three data types are the foundation of both monitoring and observability. What differs is how each discipline uses them.
| Pillar | Purpose | Example query | Decisive scenario |
|---|---|---|---|
| Metrics | Aggregated numeric measurements over time; low cardinality, cheap to store | rate(http_requests_total{job="api"}[5m]) | Detecting a sustained error rate spike across all instances |
| Logs | Timestamped, structured event records; high cardinality, expensive at scale | level=error service=checkout traceID=abc | Finding the exact exception message and stack trace for a specific failed request |
| Traces | Distributed request flows across service boundaries; linked spans with timing | Span: service=payment duration=— parent=checkout traceID=abc | Pinpointing which microservice added latency to a checkout request |
| Events/Context | Deployment markers, feature flag changes, config diffs, user IDs | Deploy event: version=— timestamp=14:32 service=api | Correlating a latency regression to a specific deploy or config change |
A metric example (PromQL):
histogram_quantile(0.99, rate(http_request_duration_seconds_bucket[5m]))This gives you p99 latency across all requests. Fast to query, cheap to store, but it tells you nothing about which request was slow or why.
A structured log line:
{"level":"error","service":"checkout","traceID":"4bf92f3577b34da6","userID":"u_8821","msg":"payment gateway timeout","duration_ms":3012}Structured fields make this queryable. The traceID field is the bridge to the trace that shows you the full call chain.
A trace span (W3C trace context):
traceparent: 00-4bf92f3577b34da6a3ce929d0e0e4736-00f067aa0ba902b7-01That header propagates through every HTTP call in the request path. Every service that receives it can attach its own span, and your tracing backend stitches them into a waterfall.
Events and enrichment context are what turn good telemetry into great observability. Knowing that a deploy happened at 14:32 and latency spiked at 14:33 is the kind of correlation that cuts investigation time from hours to minutes.
Where monitoring and observability share the same ground
Both disciplines consume the same underlying telemetry. Metrics, logs, and traces feed monitoring dashboards and observability backends alike. Monitoring and observability share telemetry (metrics, logs, traces); monitoring uses it to alert on health deviations while observability maps relationships across distributed services to support root cause analysis.
The practical handoff looks like this:
- A monitoring alert fires on a threshold breach (error rate > 5% for 2 minutes).
- The alert notification includes a trace ID or a link to a pre-filtered trace query.
- An engineer opens the trace, sees which service degraded, and queries structured logs for that service in the same time window.
- The log query surfaces a database connection pool exhaustion event.
- The engineer checks the deployment event timeline and finds a config change that reduced pool size.
Without monitoring, the incident might not surface for minutes or longer. Without observability, the engineer is stuck staring at a dashboard that confirms the symptom but offers no path to the cause.
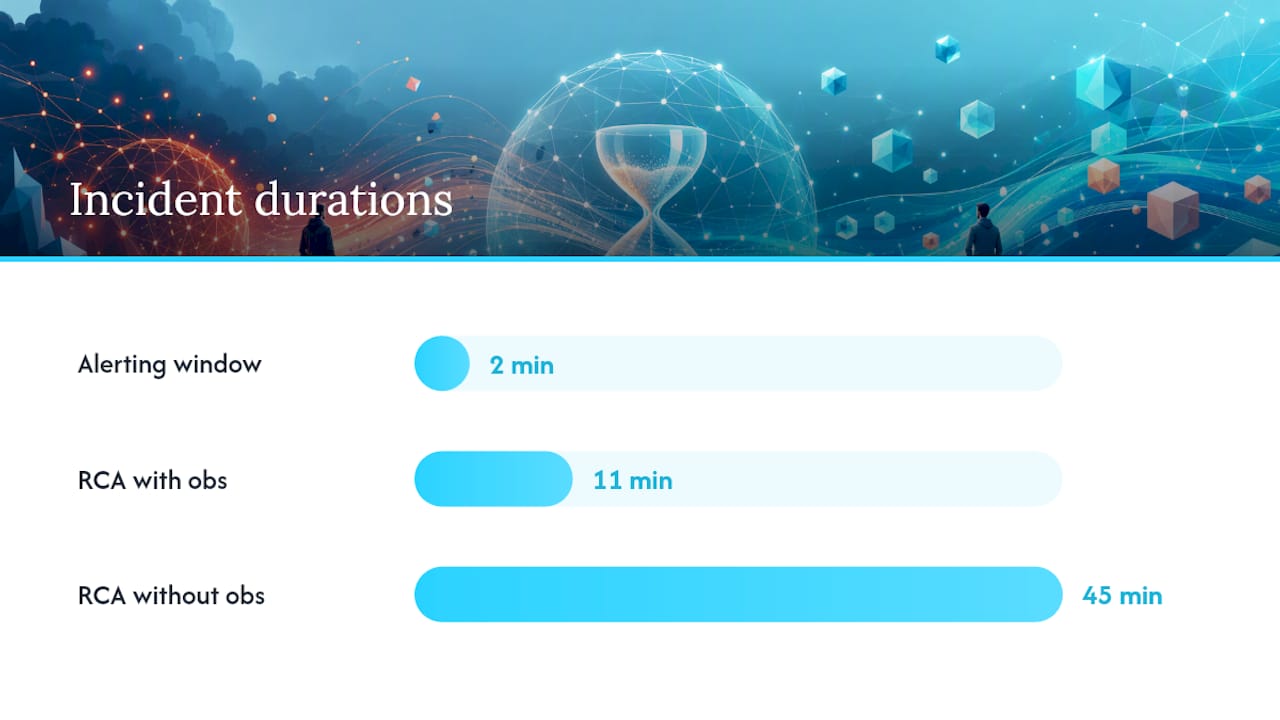
A short incident timeline illustrates this: at 14:33, a monitoring alert fires on elevated p99 latency for the order-service. The on-call SRE opens the alert, which links to a Grafana dashboard. The dashboard shows latency is up but CPU and memory are normal. With monitoring alone, the investigation stalls. The SRE switches to Jaeger, pulls traces for order-service in the 14:30–14:35 window, and immediately sees that 80% of slow traces share a long span on inventory-service. A log query on inventory-service reveals a cache miss storm triggered by a feature flag rollout at 14:32. Total time to root cause: 11 minutes instead of the usual 45.
Key differences between observability and monitoring across concrete axes
| Axis | Monitoring | Observability |
|---|---|---|
| Primary purpose | Detect known failure conditions | Diagnose unknown-unknowns and reconstruct cause |
| Scope | Component-level health signals | System-level interactions across service boundaries |
| Data emphasis | Predefined metrics and alert thresholds | High-cardinality telemetry enabling ad-hoc queries |
| Unknown-unknowns | Limited — you only catch what you pre-defined | Designed for exploration — ask new questions post-incident |
| MTTR impact | Reduces detection time (MTTA) | Reduces investigation and resolution time (MTTR) |
| Operational cost | Lower ingestion and storage cost | Higher cost; requires sampling and retention strategy |
| Instrumentation effort | Low — scrape existing endpoints | Higher — requires trace propagation, structured logging, SDK integration |
Monitoring strengths: low overhead, fast alerting, well-understood tooling, strong for SLA tracking and capacity management. Works well for monoliths and small service counts.
Monitoring limitations: siloed dashboards, no cross-service correlation, helpless against failure modes you didn’t anticipate. Observability provides flexible, unified visibility across telemetry and supports exploration and AIOps-driven analysis compared with traditional monitoring.
Observability strengths: exploratory diagnosis, high-cardinality queries, cross-service correlation, faster MTTR on complex incidents, scales with system complexity.
Observability limitations: higher cost, more instrumentation effort, requires discipline around cardinality and sampling, steeper learning curve for teams new to distributed tracing.
Quick scenario guidance:
- Small monolith or a few services: solid monitoring with structured logs is usually enough. Add tracing when incidents start taking more than 30 minutes to diagnose.
- Large microservices platform: observability is not optional. You will hit unknown-unknowns regularly.
- Data or AI workloads: observability scales with complex data and AI workloads and improves collaboration, cost optimization, and reliability in distributed environments. Trace context across pipeline stages is especially valuable.
When monitoring is enough and when to invest in observability
Not every team needs a full observability stack on day one. The decision depends on architecture complexity, incident patterns, and team maturity.
Signals that monitoring alone is working:
- Fewer than 5–10 services, mostly synchronous calls
- Incidents are consistently explained by a single metric crossing a threshold
- Mean time to diagnose is under 15 minutes
- No distributed transactions that span multiple service boundaries
Signals that you need observability:
- Incidents regularly take more than 30 minutes to diagnose
- Engineers frequently say “I can see it’s broken but I don’t know why”
- You have more than 10–15 services with complex call graphs
- You’re running async workloads, event-driven pipelines, or multi-tenant platforms
- SLO burn rate alerts fire but dashboards don’t explain the cause
Incremental adoption path:
- Start with better monitoring: structured logs, consistent metric naming, and alert runbook links.
- Add trace context propagation to your highest-traffic services using OpenTelemetry SDKs.
- Instrument structured logs with
traceIDandspanIDfields so logs and traces correlate. - Deploy an OpenTelemetry Collector to centralize telemetry routing.
- Index high-cardinality fields (user ID, tenant ID, feature flag) in your log and trace backends.
- Add SLO-based alerting on error budget burn rate rather than raw thresholds.
- Adopt advanced features (continuous profiling, AIOps anomaly detection) once the foundation is solid.
For cloud observability cost tradeoffs, the biggest lever is usually trace sampling strategy, not the choice of backend.
Pro Tip: Start with head-based sampling at 10–20% for normal traffic and 100% for error traces. This keeps ingestion costs manageable while preserving full fidelity for every failure. Revisit the sampling rate after your first month of production data.
Which tools handle monitoring vs. observability in practice
These six tools appear in most production stacks. Each plays a specific role, and knowing which one to reach for first during an incident saves real time.
-
Prometheus is a pull-based metrics collection and alerting system. It scrapes
/metricsendpoints, stores time-series data, and evaluates alert rules via Alertmanager. Prometheus is primarily a metrics collection and alerting system (monitoring) but participates in observability workflows when combined with tracing and log correlation. Reach for Prometheus first when an alert fires and you need to confirm the metric trend and scope. -
OpenTelemetry is the vendor-neutral instrumentation standard maintained by the CNCF. It provides SDKs for metrics, logs, and traces across most languages, plus a Collector for routing telemetry to any backend. OpenTelemetry is the instrumentation layer, not a storage or query backend. It’s the right starting point for any new observability investment because it avoids vendor lock-in.
-
Amazon CloudWatch is AWS’s managed monitoring and observability service. It ingests metrics, logs, and traces from AWS services natively, with minimal setup. CloudWatch Logs Insights handles structured log queries; CloudWatch ServiceLens integrates with X-Ray for distributed tracing. It’s the pragmatic choice for AWS-native stacks where operational overhead matters more than flexibility.
-
Grafana is the visualization and dashboarding layer that sits in front of almost every monitoring and observability backend. It queries Prometheus, Loki, Tempo, Elasticsearch, CloudWatch, and others through a unified interface. During an incident, Grafana is often the first screen an SRE opens. Grafana Tempo handles distributed traces; Grafana Loki handles logs. The combination gives you a full observability stack without leaving the Grafana UI.
-
Jaeger is an open-source distributed tracing system originally built at Uber. It collects, stores, and visualizes traces, making it straightforward to see the full call graph for a request. Jaeger is the right tool when you need to answer “which service in this chain added the most latency?” It integrates with OpenTelemetry natively as a trace backend.
-
Dynatrace is a full-stack observability platform with automatic instrumentation (OneAgent), AI-driven root cause analysis (Davis AI), and unified dashboards across metrics, logs, traces, and user sessions. It’s the highest-abstraction option: less manual instrumentation, more automated correlation. The tradeoff is cost and reduced control over the data model. Teams with large, complex environments and limited SRE bandwidth often find the automation worth the price.
For AI-assisted Kubernetes troubleshooting, combining Prometheus alerts with Jaeger traces and Grafana dashboards covers most incident scenarios without requiring a commercial platform.
Practitioner-grade instrumentation checklist for faster MTTR
This is the checklist I use when setting up or auditing observability for a production system. Work through it in order.
Step 1: Expose the right metrics.
Every service should expose a /metrics endpoint with at minimum: request rate, error rate, and latency histogram (the RED method). Use low-cardinality labels only on metrics (e.g., status_code, method, service). Never put user IDs or request IDs in metric labels.
Step 2: Structured logging.
Every log line should be JSON with consistent fields: timestamp, level, service, traceID, spanID, msg, and any relevant business context. Avoid free-text log messages that can’t be queried. Example:
{"timestamp":"2026-03-15T14:33:01Z","level":"error","service":"checkout","traceID":"4bf92f3577b34da6","spanID":"00f067aa0ba902b7","msg":"DB connection timeout","duration_ms":3012}Step 3: Trace propagation.
Instrument your services with the OpenTelemetry SDK. Propagate W3C traceparent headers on every outbound HTTP and gRPC call. Verify propagation is working by checking that traces in Jaeger or Tempo show complete call graphs, not orphaned spans.
Step 4: Enrich spans with deployment context.
Add resource attributes to your OpenTelemetry SDK configuration: service.version, deployment.environment, k8s.pod.name. This lets you filter traces by deploy version during an incident without querying a separate system.
Step 5: Set a sampling strategy. Use head-based sampling for normal traffic at a moderate rate and tail-based sampling or full capture for error traces. Configure this in the OpenTelemetry Collector, not in the SDK, so you can adjust it without redeploying services.
Step 6: Define retention policies. Metrics: 15 days at full resolution, 90 days downsampled. Logs: 30 days hot, 90 days cold (object storage). Traces: 7–14 days. Adjust based on your SLO review cadence and compliance requirements.
Step 7: Alert on SLO burn rate, not just thresholds. Replace raw threshold alerts with error budget burn rate alerts. A burn rate of 14x over 1 hour means you’ll exhaust your monthly error budget in 2 hours. That’s a page-worthy signal that a threshold alert on 5% error rate might miss during a slow degradation.
Step 8: Build a minimal incident playbook. For each critical service, document: the alert condition, the first PromQL query to run, the first log query to run, the trace filter to apply, and the escalation trigger. Link this from every alert notification.
Pro Tip: The most common high-cardinality trap is adding a userID or requestID label to a Prometheus metric. Each unique value creates a new time series. With millions of users, this explodes your TSDB storage and query performance. Keep those identifiers in logs and traces, where high cardinality is expected and indexed accordingly.
For endpoint visibility beyond application telemetry, osquery can extend your observability reach to the OS and kernel layer without additional instrumentation in your application code.
Key Takeaways
Observability and monitoring are complementary, not competing: monitoring detects known failures fast, while observability diagnoses the unknown-unknowns that dashboards alone can never explain.
| Point | Details |
|---|---|
| Monitoring vs. observability core split | Monitoring detects known conditions via thresholds; observability diagnoses unknown-unknowns through high-cardinality telemetry queries. |
| Three telemetry pillars | Metrics, logs, and traces each serve a distinct diagnostic role; all three are required for full incident coverage. |
| MTTR impact | Monitoring shortens detection time; observability shortens investigation and resolution time by enabling trace-guided root cause analysis. |
| When to invest in observability | Teams with more than 10–15 services, complex call graphs, or incidents that regularly take over 30 minutes to diagnose need observability, not just more alerts. |
| Devopsaitoolkit for implementation | Devopsaitoolkit’s playbooks, prompt libraries, and incident-triage tools map directly to the instrumentation checklist and runbook steps in this guide. |
The gap between what observability promises and what teams actually build
Most teams I’ve seen adopt observability backwards. They buy a platform, flip on auto-instrumentation, and assume the traces will explain everything. They don’t. What you get is a firehose of spans with no enrichment, no consistent naming, and no correlation to the deployment events that actually caused the incident.
The real work is the boring part: consistent structured logging schemas, trace context propagation that doesn’t break at the message queue boundary, and sampling strategies that don’t throw away error traces to save money. None of that comes from a vendor. It comes from treating telemetry as a first-class engineering concern, the same way you treat API contracts or database schemas.
The other thing teams underestimate is the monitoring foundation. Observability doesn’t replace your Prometheus alerts or your CloudWatch dashboards. It extends them. The alert is still what wakes you up at 2 AM. The trace is what lets you go back to sleep in 20 minutes instead of 90. Both matter, and the teams that get the most out of observability are the ones who already have tight, well-tuned monitoring underneath it.
Catching the silent degradation your monitoring misses is exactly where observability earns its keep, but only if the instrumentation is already in place before the incident happens.
Devopsaitoolkit gives you the runbooks, prompts, and tools to act on this now
Knowing the difference between monitoring and observability is one thing. Having the instrumentation playbooks, PromQL query libraries, and incident-triage prompts ready when an alert fires at 2 AM are another.
Devopsaitoolkit packages the exact workflows described in this guide into downloadable prompt packs and automation playbooks built for engineers managing Prometheus, Kubernetes, OpenStack, and production cloud infrastructure. The automation prompt library includes copy-paste prompts for incident triage, trace-guided root cause analysis, and SLO burn rate alerting, so you’re not writing queries from scratch during an active incident. The in-browser triage tools let you validate YAML configs, run structured diagnostics, and get AI-assisted analysis without leaving your browser.
If you’re ready to cut your MTTR and stop losing hours to incidents your dashboards can’t explain, start with the DevOps AI ToolKit and pick the workflow that matches where your team is today.
Useful sources and further reading
- Observability vs. Monitoring: Key differences explained | SD Times
- Observability vs. Monitoring: What’s the Difference? | IBM
- The difference between monitoring and observability | AWS
- 3 reasons why monitoring is different from observability | Elastic Blog
- Monitoring vs observability: the differences explained | Fastly
- Observability fundamentals | Snowflake
- What is Prometheus? | Grafana Cloud documentation
- Cloud observability explained for cloud engineers | Koritsu Blog
Recommended
- What Is Infrastructure Observability? A 2026 Guide
- Catching the Silent Degradation Your Monitoring Misses
- SRE vs DevOps Differences Explained for Engineers
- OpenStack Monitoring Tool Categories: 2026 Guide
Get 500 Battle-Tested DevOps AI Prompts — Free
500 battle-tested, copy-paste AI prompts engineered by a senior systems engineer — every one with fill-in placeholders and safety/back-out notes. Drop your email and it's yours.
- 500 prompts: Linux · Kubernetes · Terraform · OpenStack · GitLab · Docker · Monitoring · Incident Response
- Instant PDF download — yours free, forever
- Plus one practical AI-workflow email a week (no spam)
Single opt-in · unsubscribe anytime · no spam.