
The Role of DORA Metrics in DevOps Performance
Discover the role of DORA metrics in DevOps performance. Learn how these key indicators enhance software delivery and team efficiency.

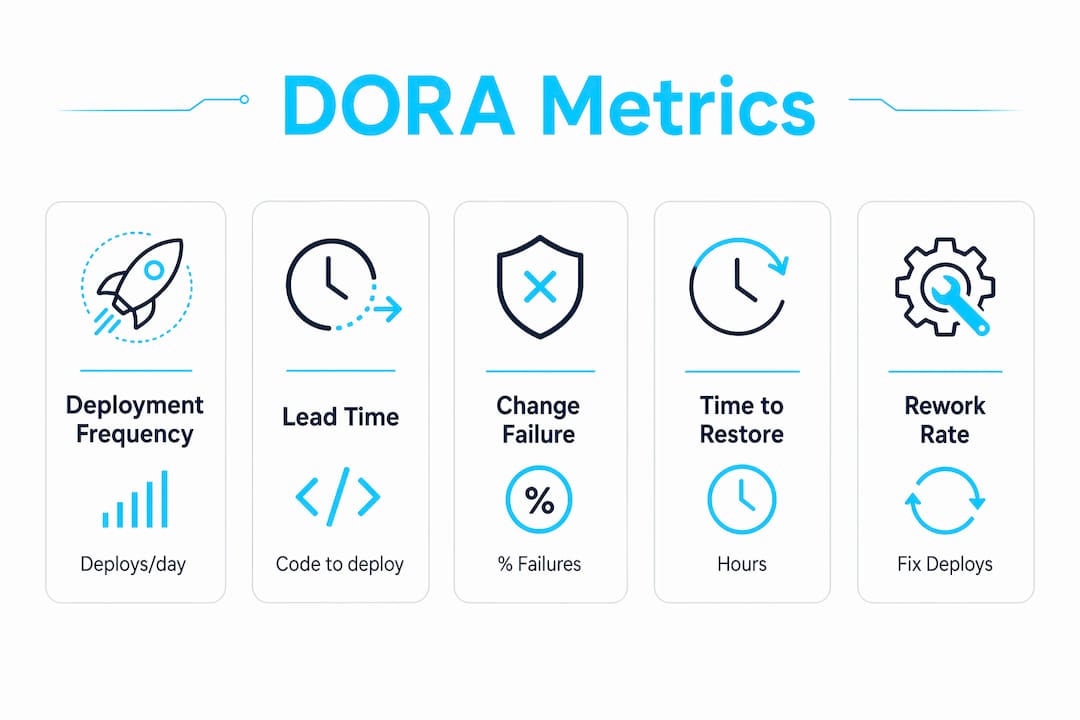
DORA metrics are five core software delivery indicators that measure how fast and how reliably engineering teams ship software to production. The role of DORA metrics in DevOps goes beyond simple tracking. These measurements give teams and leadership a shared, evidence-based language for diagnosing delivery health and driving real improvement. The DORA framework, developed by the DevOps Research and Assessment program, covers two dimensions: throughput and stability. Elite teams maintain a change failure rate under 5% and restore service in under one hour. Those benchmarks set the bar for what high performance actually looks like.
What are the five core DORA metrics and how do they measure DevOps performance?
The DORA framework splits its five metrics into two groups: throughput and stability. Getting both right is the whole game.
Throughput metrics measure how fast your team delivers:
- Deployment Frequency: How often you deploy to production. Elite teams deploy on demand, sometimes multiple times per day.
- Lead Time for Changes: The time from a code commit to that code running in production. Shorter lead times signal a healthy, unblocked pipeline.
Stability metrics measure how well your system holds up:
- Change Failure Rate: The percentage of deployments that cause a production incident or require a hotfix. Elite teams keep this below 5%, which means nearly every deployment succeeds cleanly.
- Time to Restore Service: How long it takes to recover from a production failure. The elite benchmark is under one hour. For a deeper look at the incident metrics that feed this number, the MTTA, MTTR, and MTBF guide on Devopsaitoolkit breaks down each component.
- Deployment Rework Rate: Added in 2024, this metric captures the ratio of unplanned fix deployments following production incidents. It fills a blind spot that Change Failure Rate alone can miss.
Here is how the two dimensions compare at a glance:
| Dimension | Metric | Elite benchmark |
|---|---|---|
| Throughput | Deployment Frequency | On demand (multiple/day) |
| Throughput | Lead Time for Changes | Less than one hour |
| Stability | Change Failure Rate | Less than 5% |
| Stability | Time to Restore Service | Less than one hour |
| Stability | Deployment Rework Rate | Trending toward zero |
The critical insight here is balance. A team that ships 20 times a day but breaks production on every third deploy is not performing well. DORA metrics make that imbalance visible immediately.
Pro Tip: Track throughput and stability metrics side by side on a single dashboard. If deployment frequency climbs while change failure rate also climbs, you are trading reliability for speed. That trade never ends well.
How do DORA metrics impact organizational outcomes and team culture?
Organizations with high DORA maturity are twice as likely to exceed profitability targets compared to low performers. That correlation is not accidental. Teams that ship frequently and recover fast spend less time firefighting and more time building features customers want.
The cultural impact matters just as much as the financial one. DORA metrics measure systems and team performance, not individual productivity. That distinction is everything. When leadership understands this, the metrics become a tool for identifying process bottlenecks, not for rating engineers.
The risks of misuse are real and well documented:
- Using DORA scores to evaluate individual developers encourages gaming the numbers.
- Threshold-based OKRs at the individual level push engineers to avoid risky but necessary changes.
- Treating metrics as a scorecard creates blame culture, which kills psychological safety.
DORA metrics are most effective as a shared diagnostic language between engineering, leadership, and management. When everyone reads from the same data, conversations shift from “who broke it” to “what in our system made this failure possible.”
“DORA metrics should never be used as a performance scorecard for individuals. The moment you attach them to individual reviews, engineers stop optimizing for delivery health and start optimizing for the metric. Those are very different things.”
Pro Tip: When introducing DORA metrics to leadership, frame them as system health indicators, not team grades. That framing prevents the most common and damaging misuse pattern.
High-performing teams use DORA metrics to pinpoint bottlenecks and guide infrastructure investments. Developers, engineering managers, and executives all get useful signal from the same five numbers, which makes cross-functional conversations much easier.
What are effective strategies for implementing DORA metrics in DevOps?
Getting DORA data right is harder than it looks. The core challenge is fragmentation. Your deployment frequency data lives in GitHub or GitLab. Your incident data lives in PagerDuty. Your ticket data lives in Jira. None of these tools talk to each other by default.

Accurate DORA measurement requires automated observability platforms that correlate signals end-to-end. Manual collection from multiple sources introduces inconsistency and measurement drift over time. The teams that get this right invest early in tooling that aggregates data automatically.
Here is a practical implementation sequence:
- Define your metrics consistently. Agree on what counts as a “deployment” and what counts as a “failure” before you collect a single data point. Inconsistent definitions produce useless data.
- Automate data collection. Connect your CI/CD pipeline, incident management tool, and version control system to a central aggregation layer. Manual spreadsheets do not scale.
- Establish a baseline. Run the metrics for 30–60 days before drawing any conclusions. You need a baseline to measure improvement against.
- Review trends, not snapshots. A single week of data tells you nothing. Monthly trend lines tell you whether your changes are working.
- Use metrics to open conversations, not close them. When a metric degrades, treat it as a prompt for a blameless postmortem, not a performance review.
DORA metrics are lagging indicators sitting on top of detailed CI/CD observability. A healthy DORA score can still mask friction in granular pipeline signals like commit-to-review time or CI test duration. You need both layers. The automated rollback strategies guide on Devopsaitoolkit covers deployment stability techniques that directly support your stability metrics.
Pro Tip: Never set a DORA metric as a hard OKR threshold. “Achieve elite tier by Q3” sounds motivating but drives the wrong behavior. Use DORA to diagnose and improve, not to score.
How does Deployment Rework Rate improve delivery stability tracking?
Deployment Rework Rate is the newest addition to the DORA framework, added in 2024 to address a specific blind spot in Change Failure Rate. Where Change Failure Rate counts the percentage of deployments that cause incidents, Deployment Rework Rate counts the rate of unplanned fix deployments that follow those incidents.
The difference matters in practice. A team might have a low Change Failure Rate because they classify hotfixes as “planned deployments.” Deployment Rework Rate catches that pattern directly.
Here is what this metric reveals that Change Failure Rate misses:
- Repeated fix-on-fix cycles that indicate a deeper architectural problem.
- Teams shipping fast but spending significant capacity on unplanned remediation work.
- Stability debt accumulating beneath a surface-level healthy deployment frequency.
| Metric | What it measures | What it misses |
|---|---|---|
| Change Failure Rate | % of deployments causing incidents | Unplanned fix deployments post-incident |
| Deployment Rework Rate | Rate of unplanned re-deployments | Initial incident trigger |
The introduction of Deployment Rework Rate addresses a critical stability blind spot by quantifying unplanned re-deployments due to production failures. Teams that optimize purely for deployment frequency without watching this metric often discover they are shipping fixes faster than features.
The practical response to a rising Deployment Rework Rate is a blameless postmortem focused on the deployment pipeline itself. Check your testing coverage, your feature flag usage, and your rollback automation. The confidence-gated auto-remediation patterns on Devopsaitoolkit are directly relevant here.
Pro Tip: Set a weekly review of Deployment Rework Rate alongside Deployment Frequency. If rework rate trends up as frequency increases, you have a stability problem hiding behind a throughput win.
Key Takeaways
DORA metrics work because they measure the system, not the individual, giving teams and leadership a shared language for sustainable delivery improvement.
| Point | Details |
|---|---|
| Five metrics, two dimensions | DORA covers throughput (frequency, lead time) and stability (failure rate, restore time, rework rate). |
| Elite benchmarks are specific | Less than 5% change failure rate and under one hour to restore service define elite performance. |
| Misuse destroys culture | Applying DORA to individual evaluations drives gaming and blame, not improvement. |
| Deployment Rework Rate fills a gap | This 2024 addition catches unplanned fix cycles that Change Failure Rate alone misses. |
| Automation is non-negotiable | Fragmented toolchains require automated data aggregation to produce reliable DORA measurements. |
What I have learned from watching teams get DORA wrong
I have seen DORA metrics introduced with the best intentions and watched them quietly poison engineering culture within two quarters. The pattern is almost always the same. Leadership gets excited about the framework, sets elite-tier targets as OKRs, and then wonders why engineers start closing incidents faster without actually fixing the underlying problems.
The uncomfortable truth is that DORA metrics are a mirror, not a lever. They show you what is happening. They do not fix it for you. Teams that treat them as a scorecard miss the entire point. The humanizing AI in metrics analysis piece on Devopsaitoolkit captures this well: the human context behind the numbers matters as much as the numbers themselves.
What actually works is using DORA as a conversation starter in retrospectives. When Time to Restore Service spikes, the right question is “what made this incident take longer to resolve?” not “who was on call?” That shift from blame to systems thinking is where the real value lives. Psychological safety is not a soft concept here. It is a prerequisite for honest data.
My strongest advice: introduce one metric at a time. Start with Deployment Frequency because it is the easiest to measure and the least threatening. Build trust in the data before you add Change Failure Rate or Deployment Rework Rate. Teams that try to instrument all five metrics simultaneously usually end up with inconsistent definitions and low confidence in the output. Slow and deliberate beats fast and fragile, even when measuring DevOps performance.
— James
Devopsaitoolkit: AI workflows built for DORA metric tracking
Pulling DORA data from GitHub, Jira, PagerDuty, and your CI/CD pipeline into one coherent view is exactly the kind of problem that eats engineering hours.
Devopsaitoolkit provides AI-powered DevOps workflows designed for engineers managing production infrastructure across Linux, Kubernetes, GitLab, and Prometheus. The prompt libraries and automation guides cover data aggregation, incident response, and deployment monitoring, all of which feed directly into accurate DORA measurements. If you are ready to move from manual metric collection to automated observability, Devopsaitoolkit gives you the workflows to get there without rebuilding your toolchain from scratch.
FAQ
What are the five DORA metrics?
The five DORA metrics are Deployment Frequency, Lead Time for Changes, Change Failure Rate, Time to Restore Service, and Deployment Rework Rate. The first two measure throughput; the last three measure stability.
What is the elite benchmark for DORA metrics?
Elite teams maintain a change failure rate below 5% and restore service in under one hour. Deployment Frequency at the elite level means deploying on demand, often multiple times per day.
Why should DORA metrics not be used for individual performance reviews?
Applying DORA metrics to individual evaluations encourages engineers to game the numbers rather than fix root causes. These metrics measure system and team performance, not individual output.
What is Deployment Rework Rate and why was it added?
Deployment Rework Rate measures the rate of unplanned fix deployments following production incidents. It was added to the DORA framework in 2024 to capture stability issues that Change Failure Rate alone does not surface.
How do you collect DORA metrics accurately?
Accurate DORA measurement requires automated observability platforms that correlate data across your CI/CD pipeline, version control, and incident management tools. Manual collection from fragmented sources produces inconsistent results.
Recommended
- Humanizing Artificial Intelligence in Metrics Analysis
- Incident Metrics That Matter: MTTA, MTTR, and MTBF
- Tuning Pod Resource Requests From Real Metrics With AI
- Monitoring-as-a-Service with OpenStack Monasca and AI
Get 500 Battle-Tested DevOps AI Prompts — Free
500 battle-tested, copy-paste AI prompts engineered by a senior systems engineer — every one with fill-in placeholders and safety/back-out notes. Drop your email and it's yours.
- 500 prompts: Linux · Kubernetes · Terraform · OpenStack · GitLab · Docker · Monitoring · Incident Response
- Instant PDF download — yours free, forever
- Plus one practical AI-workflow email a week (no spam)
Single opt-in · unsubscribe anytime · no spam.