
Service Mesh in Kubernetes Explained for DevOps Engineers
Discover how a service mesh in Kubernetes improves security and traffic control. Get a clear, concise explanation of its benefits for DevOps engineers.

A service mesh in Kubernetes is a dedicated infrastructure layer that handles service-to-service communication, pulling security (mTLS), observability, and traffic control out of your application code and into the platform itself. The data plane runs as sidecar proxies, typically Envoy, injected alongside each pod. The control plane coordinates those proxies, pushing routing rules, rotating certificates, and exposing operator APIs. Workload identities follow the SPIFFE standard, so every service gets a cryptographic identity tied to its Kubernetes service account. If you’re running only a few microservices with no zero-trust requirements, you may not need a service mesh yet. Once you start managing more microservices with zero-trust requirements, a mesh can provide valuable benefits.
Table of Contents
- What does a service mesh actually do in Kubernetes?
- How does a service mesh work: data plane, control plane, and sidecars
- What are the real benefits of running a service mesh?
- Which service mesh tool should you use in Kubernetes?
- Do you actually need a service mesh right now?
- How to get started with a service mesh in Kubernetes
- How to run a service mesh in production without it eating your weekends
- Key Takeaways
- The case for going slow with a service mesh
- Devopsaitoolkit has the playbooks to make your mesh rollout stick
- Useful sources and official docs to read next
What does a service mesh actually do in Kubernetes?
A service mesh handles service-to-service communication only. It is not an API gateway, and it does not replace Ingress. Its scope is east-west traffic between pods inside the cluster.
The three core goals map directly to problems that get painful at scale. First, security: the mesh automates mTLS between every pod pair using SPIFFE-based workload identities, with certificate rotation handled by the control plane. Second, observability: RED metrics (rate, errors, duration) flow into Prometheus format and trace headers propagate without any code changes in your services. Third, traffic control: weighted routing, canary releases, retries, timeouts, and circuit breakers become platform-level configuration rather than library code scattered across repos.
This shift in ownership matters operationally. Developers stop writing retry logic and TLS boilerplate. Platform engineers own the networking policies and telemetry pipeline. That separation is clean in theory and genuinely useful in practice when your microservices architecture grows past the point where per-service library updates become a coordination nightmare.
Three concrete scenarios where a mesh earns its keep: a multi-tenant cluster where different teams need strict traffic isolation without writing custom NetworkPolicy for every pair; a progressive delivery workflow with canary traffic and latency monitoring before promotion; and an SRE team that needs distributed traces across a large number of services without instrumenting each one individually.
How does a service mesh work: data plane, control plane, and sidecars
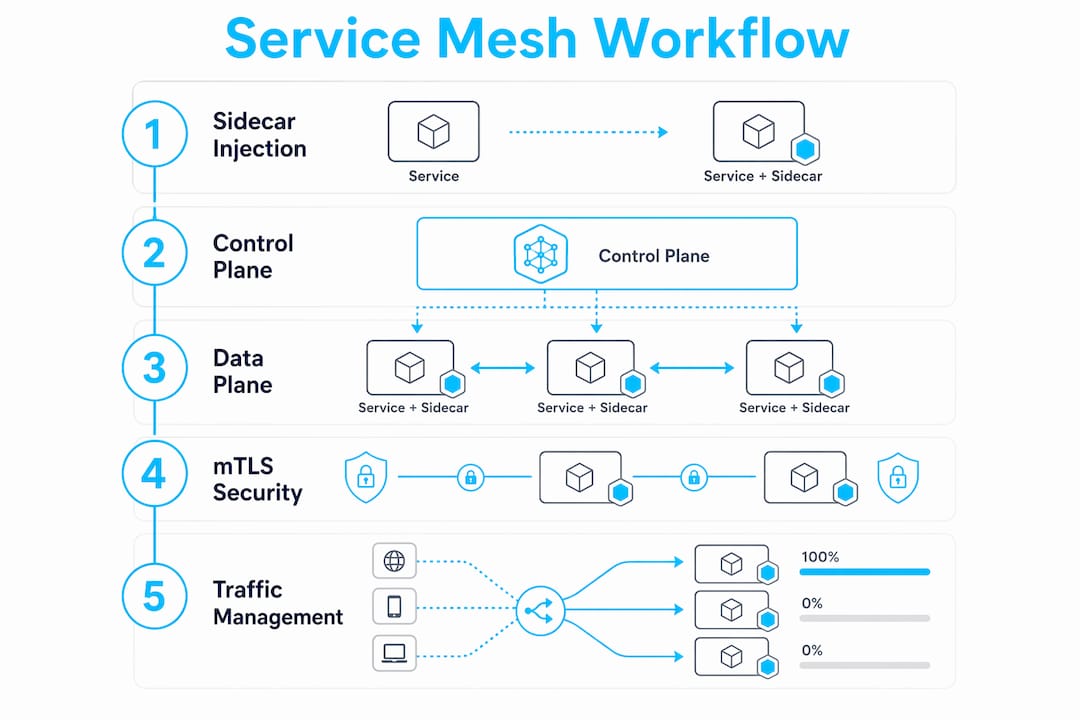
The architecture is two layers. The data plane intercepts all pod-to-pod traffic and processes it. The control plane configures the data plane proxies and keeps them synchronized with cluster state.
Here’s the request flow in practice:
- Your app container sends a request to another service.
- iptables rules (set up by an init container at pod startup) redirect that traffic to the local sidecar proxy before it leaves the pod.
- The sidecar proxy (usually Envoy) establishes an mTLS connection to the destination pod’s sidecar proxy, authenticating both sides using SPIFFE certificates.
- The destination sidecar decrypts the traffic and forwards it to the local app container.
- Throughout this, both sidecars emit metrics, access logs, and trace spans.
The control plane pushes configuration to proxies using the xDS API, a set of discovery services (Listener, Route, Cluster, Endpoint) that Envoy understands natively. When you apply an Istio VirtualService or a Linkerd TrafficSplit, the control plane translates that into xDS config and pushes it to the relevant proxies within seconds.
Sidecar injection happens two ways: automatic (a mutating admission webhook adds the sidecar container and init container to pods in labeled namespaces) or manual (you annotate individual pods). Automatic injection is the standard path for most teams.

Pro Tip: Certificate rotation is one of the first operational surprises. Istio’s default certificate TTL is 24 hours, and rotation happens automatically, but if your control plane is degraded during rotation, proxies can end up with expired certs and start rejecting traffic. Monitor istio_agent_cert_expiry_seconds in Prometheus and alert before expiry, not after.
During early validation, check istioctl proxy-status to confirm all proxies are synced, and look at the Kiali graph or Grafana service map to verify traffic is flowing through the mesh before you enable any policies.
What are the real benefits of running a service mesh?
Security with mTLS and SPIFFE identities is the most defensible reason to adopt a mesh. Every pod gets a SPIFFE SVID (an X.509 certificate tied to its Kubernetes service account), and the mesh enforces mutual authentication on every connection. You get zero-trust pod-to-pod security without touching application code. The migration path matters: start in permissive mode (plaintext and mTLS both accepted), build your dependency map, then flip to strict mode service by service.

Observability without instrumentation is the second major win. Because the mesh routes all pod-to-pod traffic through proxies, it can emit RED metrics in Prometheus format, B3 or W3C trace headers, and structured access logs for every service pair. An SRE team debugging a latency spike in a 200-service cluster can pull a service topology graph and distributed traces without waiting for developers to add instrumentation to each service.
Traffic control at the platform level covers canary deployments, A/B testing, fault injection, retries, and circuit breakers. A team running a canary can split traffic 95/5 between stable and canary versions, watch p99 latency and error rate in real time, and promote or roll back without a code deploy. Fault injection lets you test resilience by injecting artificial delays or HTTP 500s into specific routes in staging.
Not every cluster needs this. If you’re running a handful of services with standard Kubernetes NetworkPolicy and client-side libraries for retries, a mesh adds complexity without proportional value. The decision checklist in the next section will help you figure out which side of that line you’re on.
Which service mesh tool should you use in Kubernetes?
Each project has a primary strength and a natural home. Istio is the most feature-complete. Linkerd is the lightest. Consul Connect fits HashiCorp shops. NGINX Service Mesh is straightforward for teams already running NGINX. Envoy is the proxy that most of them run under the hood.
| Dimension | Istio | Linkerd | Consul Connect | NGINX Service Mesh | Envoy |
|---|---|---|---|---|---|
| Primary strength / best for | Full-featured; enterprise multi-cluster | Lightweight; simplicity-first | HashiCorp ecosystem; multi-platform | NGINX-native; easy onboarding | Proxy core; embedded in other meshes |
| Complexity / operational overhead | High | Low | Medium | Low–Medium | High (DIY control plane) |
| mTLS support / cert rotation | Yes; SPIFFE/SPIRE; auto-rotation | Yes; automatic; zero-config | Yes; Vault integration | Yes; auto-rotation | Yes (when paired with control plane) |
| Observability / telemetry | Prometheus, Jaeger, Zipkin, Kiali | Prometheus, Grafana, Buoyant Cloud | Prometheus, Grafana | Prometheus, Grafana | Depends on control plane |
| Install / upgrade experience | Helm or istioctl; complex upgrades | linkerd CLI; smooth upgrades | Helm; tied to Consul release cycle | Helm; straightforward | Manual; no standard upgrade path |
| Community / CNCF status | CNCF Graduated | CNCF Graduated | CNCF (Consul); broad ecosystem | NGINX community | CNCF Graduated |
Istio is the right call when you need multi-cluster routing, fine-grained traffic policies, and a large ecosystem of integrations. The operational overhead is real, and upgrades require careful version compatibility checks, but the xDS-based control plane gives you more knobs than any other option. Check the Istio and Linkerd basics guide if you want a side-by-side install walkthrough.
Linkerd runs a Rust-based micro-proxy instead of Envoy, which means lower per-pod resource consumption and a simpler operational model. If your team is new to service meshes and wants to start with observability and mTLS without a steep learning curve, Linkerd is the fastest path to value.
Consul Connect makes sense when you’re already running Consul for service discovery or managing a hybrid environment that spans Kubernetes and VMs. The Vault integration for certificate management is a genuine advantage in regulated environments.
NGINX Service Mesh is worth considering if your team already operates NGINX Ingress and wants a mesh with a familiar operational model. It’s less feature-rich than Istio but easier to reason about for teams that haven’t run a mesh before.
Envoy on its own is a proxy, not a mesh. It’s the data plane that Istio, Consul Connect, and others use. You wouldn’t run Envoy directly as a mesh unless you’re building a custom control plane, which is a significant engineering investment.
Sidecar-less options are worth knowing about: Istio’s ambient mode and Cilium use per-node proxies or eBPF instead of per-pod sidecars, reducing per-pod overhead at the cost of a newer, less battle-tested architecture. Worth watching for greenfield clusters.
Always validate your upgrade path in staging before touching production. Control-plane and data-plane versions need to stay compatible, and skipping minor versions can break xDS config delivery.
Do you actually need a service mesh right now?
Maybe. Only when your requirements exceed what Kubernetes and standard libraries can provide in a maintainable way.
The honest trade-offs first. Every sidecar proxy adds CPU and memory overhead per pod. At scale, that overhead is a real line item in your cloud bill and your cluster autoscaling calculations. The control plane itself needs HA, monitoring, and a planned upgrade strategy. Troubleshooting a misconfigured mesh can be harder than debugging raw Kubernetes networking because there are more layers to inspect. And when microservice counts scale into the hundreds, a mesh becomes standard practice, but it also requires a mature DevOps team to operate safely.
Run through this checklist before committing:
- Do you have a significant number of services with frequent pod-to-pod calls? Below that, per-service library configuration is usually manageable.
- Do you have a strict zero-trust or compliance requirement for encrypted pod-to-pod traffic? If yes, automated mTLS is the cleanest path.
- Do you need automated certificate rotation across all services? Manual cert management at scale is error-prone.
- Do you need platform-level telemetry without per-service instrumentation? A mesh gives you this for free.
- Are you routing traffic across multiple clusters or doing complex canary/A-B deployments? This is where a mesh pays off most clearly.
- Does your team have bandwidth to own control-plane upgrades and proxy resource monitoring? If not, defer until you do.
If you answered yes to three or more, a mesh is worth trialing. If you’re still unsure, the service mesh role in DevOps guide walks through organizational readiness signals in more detail.
Pro Tip: Start with observability and permissive mTLS. Add routing policies only after you’ve run the mesh for a few weeks and built a real dependency map from telemetry. Skipping that step and going straight to strict policies is the most common cause of production incidents during mesh adoption.
How to get started with a service mesh in Kubernetes
Start small, measure telemetry, then expand policies.
Preflight checklist:
- Kubernetes 1.21+ with admission webhooks enabled
- Sufficient node capacity for sidecar resource requests (budget at minimum 100m CPU and 128Mi memory per sidecar, more for Istio’s Envoy)
- RBAC permissions to install CRDs and create cluster-scoped resources
- PodSecurity policies or Pod Security Admission configured to allow sidecar init containers
- A staging namespace isolated from production for initial rollout
Minimal starter path:
- Install the mesh control plane (e.g.,
istioctl install --set profile=minimalorlinkerd install | kubectl apply -f -) and verify control-plane pods are healthy. - Label a single non-critical namespace for sidecar injection (
kubectl label namespace staging istio-injection=enabled). - Deploy a few services into that namespace and confirm proxies are injected (
kubectl get pods -n stagingshould show 2/2 containers per pod). - Enable permissive mTLS and let it run for a week. Pull RED metrics from Prometheus and build a service dependency map.
- Enable strict mTLS for one low-risk service and run smoke tests. Validate with
istioctl authn tls-check <pod> <service>. - Apply a simple traffic split (90/10 canary) using a
VirtualServiceand watch error rate and p99 latency in Grafana before promoting.
For mTLS migration patterns between permissive and strict mode, the Istio and Linkerd comparison covers the exact annotation and policy steps.
Pro Tip: Roll out injection namespace by namespace, not cluster-wide on day one. A per-namespace rollout lets you catch resource issues and misconfigured policies before they affect the whole cluster. It also makes rollback trivial: remove the namespace label and restart pods.
How to run a service mesh in production without it eating your weekends
Run the mesh like any other distributed system: plan for upgrades, capacity, and observability before the first production pod gets a sidecar.
Common pitfalls that burn teams:
- Enabling strict mTLS before confirming every service in the dependency graph is mesh-enrolled. One non-enrolled service breaks all calls to it.
- Over-configuring traffic rules early. Start with defaults; add
VirtualServiceandDestinationRuleobjects only when you have a specific need. - Ignoring proxy resource overhead in autoscaling calculations. Sidecar resource requests don’t show up in your app’s HPA metrics but they consume real node capacity.
- Running a single-replica control plane. Istio’s
istiodand Linkerd’s control plane both support HA deployments; use them in production.
Operational checklist for production readiness:
- Version compatibility: confirm proxy version matches control-plane minor version before upgrading
- Canary upgrade: upgrade
istiodfirst, then roll proxies namespace by namespace - Certificate rotation plan: monitor cert expiry metrics; set alerts at 20% of TTL remaining
- Resource monitoring: track sidecar CPU/memory per namespace; set alerts on p95/p99 proxy latency
- xDS sync health: alert on proxies reporting
STALEinistioctl proxy-status
Troubleshooting commands worth keeping in your runbook:
# Check proxy sync status across the mesh
istioctl proxy-status

# Inspect xDS config delivered to a specific pod
istioctl proxy-config cluster <pod-name>.<namespace>

# Check certificate status and expiry for a pod
istioctl proxy-config secret <pod-name>.<namespace>

# Tail sidecar proxy logs for a specific pod
kubectl logs <pod-name> -c istio-proxy -n <namespace> --tail=100

# Verify mTLS is enforced between two services
istioctl authn tls-check <pod-name>.<namespace> <service>.<namespace>.svc.cluster.local
For debugging Kubernetes service connectivity issues that surface through mesh telemetry, pairing these commands with an AI copilot cuts triage time significantly. Safe rollback: if a mesh upgrade breaks traffic, roll back istiod to the previous version first, then restart affected proxy pods. Proxy and control-plane version mismatches are the most common upgrade failure mode, and the fix is almost always to re-align versions rather than patch config.
Key Takeaways
A service mesh in Kubernetes is worth adopting when your platform needs automated mTLS, platform-level telemetry, or complex traffic control that application libraries can’t provide cleanly at scale.
| Point | Details |
|---|---|
| What a service mesh does | Offloads mTLS, observability, and traffic control from app code to a platform layer using sidecar proxies. |
| Data plane vs. control plane | Sidecar proxies (data plane) intercept traffic; the control plane pushes config and rotates certs via xDS APIs. |
| When to adopt | Use it when you have strict zero-trust requirements, need platform-level telemetry, or manage complex multi-cluster routing. |
| Main trade-off | Every sidecar adds CPU and memory overhead per pod; plan resource budgets and control-plane HA before production rollout. |
| Starter path | Install on one namespace, run permissive mTLS for a week, validate telemetry, then expand policies incrementally. |
| Devopsaitoolkit resources | Devopsaitoolkit offers prebuilt mesh playbooks, YAML snippets, and AI prompt libraries to speed safe rollouts. |
The case for going slow with a service mesh
Most of the production incidents I’ve seen with service meshes share a root cause: teams enabled the mesh cluster-wide and flipped to strict mTLS in the same change window. The mesh itself wasn’t the problem. The pace was.
The gradual approach this guide recommends, starting with observability and permissive mTLS, building a dependency map, and then expanding policies one namespace at a time, isn’t timidity. It’s the only way to validate that your mesh configuration matches your actual traffic patterns before enforcement bites you. Telemetry is the feedback loop. Without it, you’re configuring a distributed system blind.
There’s also a tendency to reach for a mesh as a solution to a security audit finding or a compliance checkbox. That’s a legitimate driver, but it’s worth being honest that a mesh adds operational surface area. The Kubernetes security hardening work you do at the pod and RBAC level is still necessary alongside a mesh, not replaced by it. A mesh secures east-west traffic; it doesn’t fix a misconfigured RBAC policy or an over-permissive PodSecurity configuration.
The teams that get the most out of a service mesh are the ones that treat it as a platform product with its own SLOs, upgrade calendar, and resource budget. That mindset shift is harder than the install.
Devopsaitoolkit has the playbooks to make your mesh rollout stick
Getting a service mesh running in staging is one thing. Running it safely in production, with upgrade playbooks, resource budgets, and mTLS migration steps already written, is where most teams lose hours they don’t have.
Devopsaitoolkit offers battle-tested mesh playbooks, prebuilt YAML snippets for Istio and Linkerd installs, and a prompt library with ready-to-run AI prompts for mesh troubleshooting, canary validation, and certificate rotation checks. Instead of writing your runbook from scratch, you start with a production-grade template and adapt it to your cluster. The AI DevOps tools suite also includes incident triage workflows that pair directly with mesh telemetry, so when a proxy saturates or a cert expires, you have a structured response path, not a blank terminal. Browse the full toolkit at Devopsaitoolkit and grab the resources that match where your mesh rollout is right now.
Useful sources and official docs to read next
These are the primary references worth bookmarking as you go deeper:
- Istio official docs — Start with the architecture overview, then the traffic management and mTLS migration sections. The
istioctlreference is the most useful day-to-day page. - Linkerd docs — The “what is a service mesh” page is unusually honest about when you don’t need one. The getting-started guide is the fastest path to a working install.
- Red Hat service mesh overview — Good for understanding SPIFFE/SPIRE identity integration and how mTLS enforcement modes work in practice.
- AWS service mesh guidance — Useful framing on organizational readiness and when mesh complexity is justified at scale.
- Tigera Kubernetes service mesh guide — Covers resource overhead, Cilium/eBPF alternatives, and practical migration advice for production clusters.
- Kubernetes Visual Handbook: Service Mesh — A concise visual reference for the sidecar architecture and telemetry flow; good for onboarding teammates who are new to the concept.
Read in this order: architecture first, then mTLS migration, then traffic management. Skipping to traffic management before you understand certificate enforcement modes is how teams end up with a mesh that’s running but not actually securing anything.
Recommended
- The Role of Service Mesh in DevOps: 2026 Guide
- Service Mesh Basics With Istio and Linkerd — DevOps AI
- Service Mesh mTLS: Istio vs Linkerd for Encrypting
- The Role of Ingress Controller in Kubernetes Explained
Get 500 Battle-Tested DevOps AI Prompts — Free
500 battle-tested, copy-paste AI prompts engineered by a senior systems engineer — every one with fill-in placeholders and safety/back-out notes. Drop your email and it's yours.
- 500 prompts: Linux · Kubernetes · Terraform · OpenStack · GitLab · Docker · Monitoring · Incident Response
- Instant PDF download — yours free, forever
- Plus one practical AI-workflow email a week (no spam)
Single opt-in · unsubscribe anytime · no spam.