
AI Anomaly Detection for SRE: Less Noise, Faster MTTR
Discover the role of AI anomaly detection in SRE. Reduce noise, enhance detection, and accelerate MTTR for improved service reliability.

AI anomaly detection turns noisy telemetry into early, contextualized signals that reduce false-positive alerts and accelerate remediation — and that’s the core role it plays in modern SRE practice. Rather than crossing a fixed threshold, these systems model what “normal” looks like across your services and surface deviations before they become customer-facing incidents.
The practical payoff is real. Practitioner guides report detection lead times of 20–40 minutes before customer-facing impact in some environments, giving on-call engineers a window to act proactively instead of reactively. Google’s own SRE teams have documented roughly a 44% reduction in mean time to mitigate for supported incidents after deploying AI-curated investigation dashboards.
Here’s what that means operationally for your team:
- Earlier detection of unknown failure modes — catching degradations that no static rule was ever written to catch
- Fewer false positives — models that adapt to diurnal and seasonal patterns stop paging you for Monday morning traffic spikes
- Enriched alerts — topology context, related deployments, and past-incident patterns attached automatically, so triage starts faster
- SLO and error-budget integration — anomaly scores tied to burn rate so you know which signals actually threaten your reliability targets
Table of Contents
- What AI anomaly detection is and why SRE teams need it
- How AI anomaly detection works in a real pipeline
- Why static thresholds break down at scale
- Concrete benefits AI anomaly detection delivers for SRE teams
- How to integrate AI anomaly detection into your observability pipeline
- Operational challenges and common failure modes to plan for
- How to evaluate an AI anomaly detection solution and measure success
- Safe deployment patterns and autonomous-agent guardrails
- Typical adoption timeline and what it actually costs
- Your practical checklist for getting started
- Key Takeaways
- The part most teams get wrong
- Devopsaitoolkit has the prompts and tools to run your pilot faster
- Useful sources and further reading
What AI anomaly detection is and why SRE teams need it
Static alerting tells you when a metric crosses a line you drew. AI anomaly detection tells you when a metric behaves in a way that doesn’t fit the pattern your system has learned — including patterns you never thought to write a rule for. That distinction matters most for the “unknown unknowns”: the subtle memory creep, the gradual p99 drift, the correlated log-error spike that no single threshold would catch.
Google SRE guidance frames this shift clearly: AI-driven detection analyzes historical time-series data to identify deviations that precede failures, moving teams from reactive incident management to proactive intervention. The model learns what normal looks like for your service, not a generic baseline.
Anomaly types SREs encounter in practice:
- Metric anomalies — unexpected spikes or dips in CPU, memory, request rate, or error rate
- Log anomalies — unusual log patterns, new error codes, or sudden frequency changes in known messages
- Trace anomalies — latency outliers in specific spans, unusual call-graph shapes, or dependency failures
Modern pipelines go further. Google’s guidance describes combining telemetry with user feedback signals using embeddings and retrieval-augmented generation (RAG) to detect outages that telemetry alone would miss — a customer-reported slowdown that doesn’t yet show in your Prometheus metrics, for example.
Connecting this to SLO workflows is where the real leverage is. When anomaly scores feed directly into error-budget burn-rate calculations, your on-call team sees which deviations are actually threatening reliability targets and which are noise. That’s the integration that makes AI anomaly detection a genuine SRE tool rather than just a monitoring add-on.
How AI anomaly detection works in a real pipeline
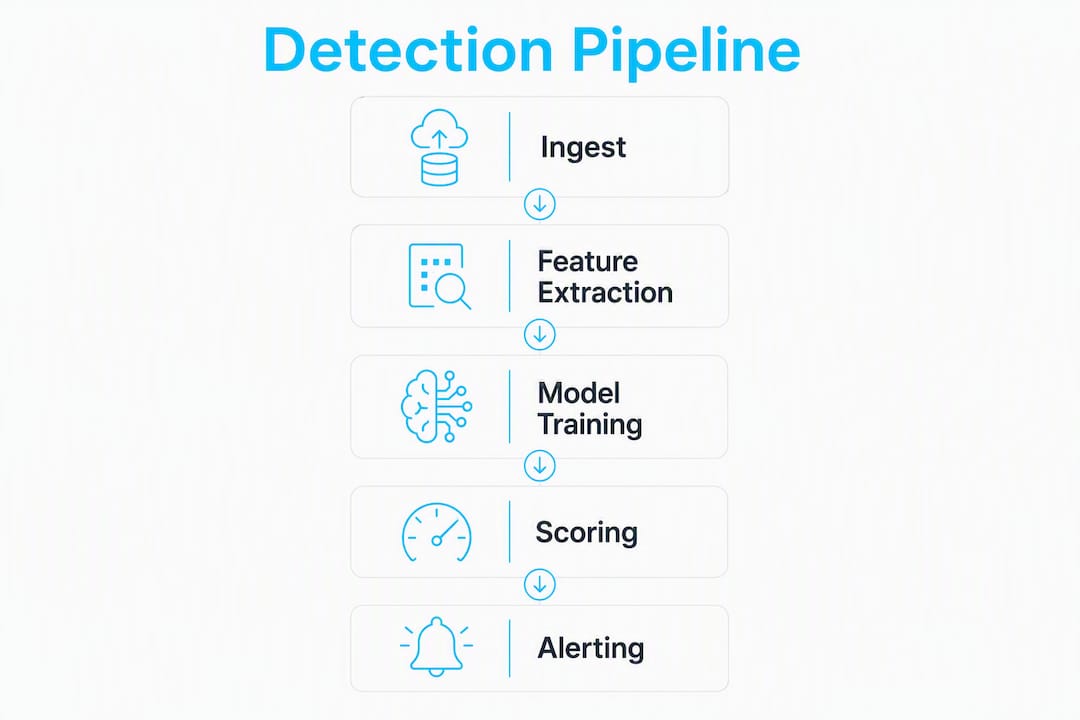
The detection pipeline has four stages, and understanding each one helps you evaluate solutions and debug them when they misbehave.

Ingest. Telemetry flows in from Prometheus metrics, OpenTelemetry traces, structured logs, and enrichment sources like deployment metadata and topology graphs. Label hygiene matters here — inconsistent labels create cardinality explosions that degrade model quality downstream.
Feature engineering. Raw time-series data gets transformed into model-ready features: rolling statistics, lag features, rate-of-change signals, and SLO burn-rate windows. Combining SLO burn rate with latency percentiles (p95, p99) as joint features gives models a much stronger signal than either alone.
Model inference. The algorithm family you choose depends on your signal shape and latency requirements:
- Streaming tree methods (Random Cut Forest, Isolation Forest) — well-suited for high-cardinality streaming workloads; commonly used in production SRE pipelines for their low latency and resistance to concept drift
Scoring and alerting. The model outputs an anomaly score. A threshold on that score (yes, there’s still a threshold — just one, on the score rather than the raw metric) triggers an alert enriched with context: related topology, recent deployments, similar past incidents. That enrichment is what cuts triage time.
Training windows typically run 2–4 weeks for services with clear weekly seasonality. Retraining cadence depends on how fast your service behavior changes — a microservice that deploys daily needs more frequent model updates than a stable batch pipeline. Practitioner guides recommend automated retraining triggers tied to deployment events rather than fixed calendar schedules.
Why static thresholds break down at scale
Every SRE team starts with static thresholds. They’re simple, auditable, and fast to set up. But at scale, they create more problems than they solve.
Context blindness. A threshold set for Tuesday afternoon traffic will fire every Monday morning when load climbs back up after the weekend. The alert is technically correct and operationally useless.
Seasonal and diurnal variance. Services with clear daily or weekly patterns need different thresholds at 2 AM versus 2 PM. Maintaining those manually across dozens of services is a full-time job nobody signed up for.
Gradual drift. If your baseline p99 latency creeps up 5ms per week, a static threshold never fires — until it does, catastrophically, when the drift finally crosses the line you set six months ago.
Combinatorial explosion. A microservices environment with 50 services, each with 10 key metrics, means 500 thresholds to tune. Add multi-condition rules and you’re in the thousands. Nobody tunes those well.
The operational cost isn’t just engineering time. Alert fatigue erodes on-call effectiveness in a way that’s hard to measure until something serious gets ignored. When every page is a potential false positive, engineers start second-guessing real incidents.
Concrete benefits AI anomaly detection delivers for SRE teams
The operational benefits map directly to the metrics SRE teams already track.
Earlier detection gives you a window to act before customers notice. The 20–40 minute lead time reported by practitioners translates directly to reduced customer impact and preserved error budget.

Fewer false positives means your on-call rotation actually trusts the alerts it receives. That trust is the foundation of effective incident response — and it’s surprisingly fragile once alert fatigue sets in.
Enriched alerts cut mean time to mitigate (MTTM). When an alert arrives with topology context, the last three deployments, and a link to a similar past incident, your engineer starts triage in the right place instead of spending the first 15 minutes orienting.
| Metric | Typical impact | Notes |
|---|---|---|
| Detection lead time | 20–40 min before customer impact | Reported by practitioner guides; varies by service type |
| MTTM reduction | ~44% for supported incidents | Google SRE internal data, AI-curated dashboards |
| False-positive rate | Reduced vs. static thresholds | Depends on training data quality and retraining cadence |
| On-call alert volume | Lower with well-tuned models | Requires ongoing feedback loops |
The 44% MTTM reduction Google reported is the most concrete benchmark available, and it came from AI-curated investigation dashboards — not full automation. That’s worth noting: you don’t need autonomous remediation to see significant operational gains.
Which benefit to target first depends on your team’s biggest pain point. If on-call fatigue is burning out your engineers, start with false-positive reduction. If your SLO burn rate is the problem, focus on detection lead time and error-budget integration.
- Reduced customer impact through earlier detection
- Lower on-call toil from fewer spurious pages
- Faster triage with context-enriched alerts
- Better SLO adherence through proactive mitigation
How to integrate AI anomaly detection into your observability pipeline
Integration is where most pilots stall. The model is the easy part; getting clean, consistent telemetry into it is the hard part.
Telemetry collection. Prometheus and OpenTelemetry are the standard collection layers for most SRE environments. Prometheus handles metrics well; OpenTelemetry spans logs, traces, and metrics in a unified format. Both feed well into long-term storage backends that anomaly models need for training windows.
Feature extraction. Pull SLO burn-rate windows, request-rate derivatives, and error-ratio trends as model inputs. Enrich with deployment metadata (what changed and when) and topology data (which services depend on this one). This context graph is what lets a model distinguish “p99 spiked because of a deployment” from “p99 spiked for no known reason.”
Alert routing. Anomaly alerts should flow into your existing incident tooling — PagerDuty, Opsgenie, or whatever your team uses — with enrichment attached. Don’t create a parallel alerting channel; that’s how signals get missed.
| Inference approach | Latency | Complexity | Data residency |
|---|---|---|---|
| Inline (in observability pipeline) | Low | Medium | Stays in your stack |
| Sidecar/streaming | Medium | High | Configurable |
| Cloud-managed inference | Low–Medium | Low | Vendor-dependent |
Key data requirements to get right before you start:
- Retention windows — most models need at least 2–4 weeks of history; seasonal models need 8+ weeks
- Cardinality management — high-cardinality label sets explode storage and degrade model performance
- Label hygiene — inconsistent service names or environment labels create training noise
Building incident timelines from Prometheus data is a practical starting point for structuring the telemetry inputs your anomaly models will consume.
Operational challenges and common failure modes to plan for
AI anomaly detection has real operational overhead. Teams that treat it as set-and-forget end up with model-tuning fatigue replacing alert fatigue — same problem, different source.
Model drift. Service behavior changes over time: new features, traffic growth, infrastructure migrations. A model trained on last quarter’s traffic patterns will start generating false positives as behavior shifts. You need automated drift detection and retraining triggers.
Data quality gaps. Missing metrics, dropped spans, and inconsistent log formats all degrade model accuracy. Telemetry gaps during incidents — exactly when you need the model most — are a common failure mode.
Explainability. When a model fires an alert, your on-call engineer needs to understand why. Black-box scores without supporting evidence erode trust fast. Prefer models and tooling that surface the contributing signals alongside the score. The explainability-first design principle is worth building into your evaluation criteria from day one.
Inference latency. For streaming detection on high-frequency metrics, inference latency matters. A model that takes 30 seconds to score a signal isn’t useful for real-time alerting.
False-negative blind spots. Optimizing hard for low false positives can push false negatives up. A model that never pages you is not a good model — it’s a model that’s learned to stay quiet.
Human factors. On-call engineers need training to interpret anomaly scores and enrichment context, not just raw metric values. Without that training, enriched alerts get ignored just like noisy ones.
How to evaluate an AI anomaly detection solution and measure success
Evaluation without a framework turns into gut-feel comparisons. Here’s a testable structure.
Core metrics to track:
- Precision — of all anomaly alerts fired, what fraction corresponded to real incidents?
- Recall — of all real incidents, what fraction did the model detect?
- False-positive rate — how many alerts required no action?
- Detection lead time — how many minutes before SLO burn or customer impact did the alert fire?
- MTTM/MTTR delta — did incidents with anomaly-detection alerts resolve faster than those without?
- Alert volume — total pages per week; trending down is the goal
Testing methodology. Shadow testing (run the model in parallel, log detections, don’t page) is the safest starting point. Synthetic injection tests — deliberately introducing known failure patterns into a staging environment — let you measure recall directly. Replay testing against historical incidents validates detection on known events.
| Metric | Recommended target | Reporting cadence |
|---|---|---|
| False-positive rate | < 20% of alerts | Weekly |
| Detection lead time | > 10 min before SLO burn | Per incident |
| MTTM delta | Trending down vs. baseline | Monthly |
| Alert volume | Decreasing week-over-week | Weekly |
| Recall on P1 incidents | — | Monthly |
Safe deployment patterns and autonomous-agent guardrails
Autonomous remediation tied to anomaly detection is powerful and genuinely risky. The Google SRE guidance on progressive authorization is the clearest framework available: start with read-only actions, expand autonomy only as confidence and audit trails accumulate.
Progressive authorization in practice:
- Observe only — model detects, logs, and enriches; no alerts fired
- Alert with context — model pages on-call with enriched context; human decides
- Suggest and confirm — model recommends a mitigation; human approves before execution
- Automated low-risk actions — throttles, circuit breakers, scaling events with human notification
- Full automation — reserved for well-understood, low-blast-radius actions with proven track records
Dynamic autonomy means downgrading agent permissions when risk scores increase. An agent that can auto-scale a service should not auto-scale a database cluster without human approval. Google’s agentic AI guidance explicitly calls for risk-score-gated authorization — the higher the blast radius, the more human oversight required.
Safety checks before any automated action:
- Dry-run the action and log the expected outcome
- Verify the justification chain (which anomaly triggered which hypothesis triggered which action)
- Score the blast radius against a predefined risk matrix
- Confirm a rollback path exists before executing
Operational governance:
- Every automated action gets a full audit trail: model inputs, anomaly score, hypothesis, action taken, outcome
- Post-automation postmortems for any action that caused unintended side effects
- Regular review of the authorization boundary — expand it deliberately, not by default
Building an AI ops copilot with guardrails walks through the implementation patterns for progressive authorization in production environments.
Advanced agentic systems build a context graph using vector embeddings across telemetry, topology, and historical incidents, letting an agent estimate blast radius and prioritize correlated components before formulating any mitigation. Middleware’s production AI SRE agent demonstrates this pattern: focused queries, hypothesis formation, validation, and only then a PR or infrastructure change — when confidence is high enough.
Safe deployment checklist:
- Authorization levels defined and documented
- Risk scoring matrix in place before any automation
- Dry-run mode tested for every action type
- Rollback path verified for each automated action
- Audit logging active and reviewed regularly
- Post-automation postmortem process defined
Typical adoption timeline and what it actually costs
Realistic expectations prevent the pilot from dying in a committee meeting.
Phased timeline:
- Pilot (2–8 weeks): Pick one service, collect and normalize telemetry, run shadow detection, define success metrics. The goal is a signal-quality baseline, not production alerts.
- Evaluate and iterate (1–3 months): Review shadow detections against actual incidents, tune scoring thresholds, add enrichment, train on-call staff on interpreting model output.
- Production rollout (3–6 months): Expand to additional services, integrate with incident tooling, establish feedback loops, and set up automated retraining triggers.
Effort breakdown by role:
- Data engineering: telemetry normalization, retention configuration, cardinality management
- ML ops: model selection, training pipeline, drift detection, retraining automation
- SRE process: feedback loop design, on-call training, alert routing integration
- Governance: audit trail setup, authorization boundary definition, postmortem process
Cost drivers to budget for:
- Long-term metric storage (Thanos, Cortex, or a managed equivalent) adds storage costs proportional to retention window and cardinality
- Inference compute scales with detection frequency and model complexity — streaming tree methods are significantly cheaper than neural approaches
- Retraining cadence drives compute costs; event-triggered retraining is more cost-efficient than daily scheduled runs
The most cost-effective starting point is a cloud-managed anomaly detection service (Azure AI Anomaly Detector, for example) for the pilot phase. It removes the ML ops overhead while you validate signal quality, and you can migrate to a self-hosted model once you know what you actually need.
Statistic callout: Detection lead times of 20–40 minutes before customer-facing impact — reported by practitioner guides — are the benchmark to validate during your pilot. If your shadow detections aren’t showing that kind of lead time on historical incidents, your feature engineering or training window needs work before you go live.
Your practical checklist for getting started
This is the checklist I’d hand to any SRE team starting a pilot. Copy it into your runbook.
Roles for the pilot:
- Data owner — owns telemetry quality, retention, and label hygiene
- SRE lead — defines success metrics, owns feedback loop, trains on-call staff
- ML ops support — manages model training, drift detection, and retraining pipeline
Step-by-step pilot checklist:
- Select one service with clear SLOs and at least 4 weeks of clean telemetry history
- Audit label consistency and fix cardinality issues before training
- Define success metrics: target false-positive rate, detection lead time, and MTTM delta
- Choose an algorithm family appropriate to your signal shape (start with Random Cut Forest for streaming metrics)
- Run shadow detection for 2 weeks minimum — log every detection, compare against actual incidents
- Review shadow results with the on-call team; tune scoring threshold based on their feedback
- Add enrichment: topology context, recent deployments, similar past incidents
- Integrate with your incident tooling in “alert with context” mode (no automation yet)
- Run for 4 weeks in production alerting mode; track your success metrics weekly
- Conduct a retrospective: did detection lead time improve? Did false-positive rate hit target?
- If metrics are positive, expand to the next service and begin planning feedback-loop automation
For faster production incident triage, the enrichment step is where most of the MTTM gains come from — don’t skip it.
Key Takeaways
AI anomaly detection delivers its biggest SRE gains when it’s integrated with SLO workflows, backed by clean telemetry, and governed with progressive automation rather than deployed as a black-box replacement for static thresholds.
| Point | Details |
|---|---|
| Detection lead time matters | Models can surface signals 20–40 min before customer impact, giving teams a real mitigation window. |
| Start with shadow mode | Run detection without alerting for at least two weeks to validate signal quality before going live. |
| Feedback loops are non-negotiable | Tag every incident outcome and feed it back to model evaluation; without this, model quality degrades silently. |
| Progressive autonomy is the safety model | Expand agent authorization incrementally, gating higher-risk actions behind human approval until track records are established. |
| Devopsaitoolkit accelerates the pilot | Ready-made Prometheus monitoring prompts and incident triage tools cut the setup time for telemetry normalization and alert enrichment. |
The part most teams get wrong
Here’s my honest read after working through a lot of SRE tooling: the teams that struggle with AI anomaly detection almost always have the same root problem. They invested in the model before they invested in the telemetry.
A sophisticated LSTM autoencoder trained on inconsistent, high-cardinality, poorly labeled metrics will perform worse than a simple z-score baseline trained on clean, well-structured data. The model is not the bottleneck. The data is. Every hour you spend on label hygiene, cardinality management, and consistent retention configuration pays back more than the same hour spent on algorithm selection.
The second mistake I see is skipping the feedback loop. Anomaly detection without a structured feedback mechanism is a model that slowly drifts toward irrelevance. Your on-call engineers are the ground truth. Build the tagging workflow before you go live, not after you’ve already burned their trust with three weeks of noisy alerts.
The CTAIO framing of AI-SRE as a converging operating model is worth taking seriously: treat your anomaly detection pipeline — the model, the feature store, the retraining jobs — as production components with their own SLOs. If your retraining pipeline fails silently for two weeks, your model is running on stale data and nobody knows. That’s an incident waiting to happen.
Start small, measure rigorously, and expand only when the signal quality justifies it.
Devopsaitoolkit has the prompts and tools to run your pilot faster
If you’re standing up an AI anomaly detection pilot and don’t want to spend the first three weeks writing prompts from scratch, Devopsaitoolkit has what you need. The Prometheus and monitoring prompt library gives you 165 copy-paste prompts for alert enrichment, metric analysis, and incident triage — directly applicable to the enrichment and shadow-testing stages of the checklist above.
The incident triage tools handle the alert-enrichment workflow in-browser, pulling topology context and past-incident patterns without requiring you to build a custom pipeline first. For teams that need guardrails and governance set up correctly from the start, the consulting and infrastructure audit services cover the authorization boundary design and audit trail configuration that most pilots skip.
- Prometheus monitoring prompts — 165 ready-made prompts for metric analysis and alert enrichment
Browse the full toolkit and start your pilot with the infrastructure already in place.
Useful sources and further reading
The sources below are the most actionable references for SRE teams building or evaluating AI anomaly detection pipelines.
- AI Engineering for Reliable Operations — Google SRE’s primary guidance on agentic AI, progressive authorization, and context graphs; the authoritative source for governance patterns.
- AI-Assisted Incident Management in SRE — peer-reviewed research on LLMs and anomaly detection in SRE, with a focus on financial platforms where reliability requirements are highest.
- What Is Anomaly Detection? — IBM’s conceptual overview; useful background for stakeholders who need a non-technical introduction before a pilot proposal.
- Devopsaitoolkit — prompt libraries, incident triage tools, and consulting for SRE teams adopting AI-driven workflows in production.
Recommended
- Best AI Tools for SRE Teams in 2026 (A Practitioner’s Guide)
- Reduce MTTR with AI AI Prompts — 44 Free, Copy-Paste Prompts
- Cutting Time-to-Detect With AI Anomaly Summarization
- Reducing MTTR: Where the Time Actually Goes and How to Cut It — DevOps AI ToolKit
Get 500 Battle-Tested DevOps AI Prompts — Free
500 battle-tested, copy-paste AI prompts engineered by a senior systems engineer — every one with fill-in placeholders and safety/back-out notes. Drop your email and it's yours.
- 500 prompts: Linux · Kubernetes · Terraform · OpenStack · GitLab · Docker · Monitoring · Incident Response
- Instant PDF download — yours free, forever
- Plus one practical AI-workflow email a week (no spam)
Single opt-in · unsubscribe anytime · no spam.