
Prometheus Retention Settings: Defaults and Production Rules
Optimize your Prometheus retention settings to keep crucial data accessible for 30-60 days, enhancing your postmortem analysis.

If you haven’t touched retention on your Prometheus setup, you’re running on the default: 15 days of local storage, defined by --storage.tsdb.retention.time. That’s the flag that governs how long samples stay queryable before Prometheus deletes them, and for most production environments, 15 days is too short to be useful during a postmortem.
Prometheus gives you two retention controls, and you can use either or both:
- Time-based retention (
storage.tsdb.retention.time): deletes data older than a set duration. - Size-based retention (
storage.tsdb.retention.size): caps the total disk footprint of persisted blocks. - Default behavior: 15 days if nothing is configured.
- Production guidance: aim for 30–60 days locally, and if you set a size limit, keep it at no more than 80–85% of your allocated disk to leave headroom for compaction.
- Beyond that window: push data to remote long-term storage instead of stretching local retention indefinitely.
The rest of this piece walks through why that headroom number matters, how Prometheus actually stores data on disk, and how to change retention without triggering a 2 AM disk-pressure page.
Key Takeaways
Prometheus retention succeeds when engineers pair the 80–85% disk-headroom rule with an accurate read of compaction and WAL behavior, not just a single retention flag.
| Point | Details |
|---|---|
| Default is 15 days | Without configuration, Prometheus deletes data older than 15 days automatically. |
| Two controls, one winner | Time-based and size-based retention can both be set, but whichever triggers first deletes data. |
| Leave 15% disk buffer | Cap retention.size at 80–85% of disk to absorb compaction’s temporary duplication. |
| Cleanup isn’t instant | Expired blocks can take up to two hours to clear, so disk relief after a retention cut is gradual. |
| Use Devopsaitoolkit for rollout planning | Devopsaitoolkit’s playbooks and consulting help teams size retention and automate remote_write safely. |
Table of Contents
- How Does Prometheus TSDB Store Data on Disk?
- Time-Based vs. Size-Based Retention: Which Flag Do You Need?
- How Much Disk Do You Need for Your Retention Window?
- How Do You Check and Change Prometheus Retention Settings?
- What Operational Surprises Should You Plan For?
- When Should You Use Remote Storage Instead of Longer Local Retention?
- What’s James’s Production Checklist for Changing Retention?
- Sources
How Does Prometheus TSDB Store Data on Disk?
Prometheus’s storage engine, the TSDB (time series database), writes data in a specific sequence that explains almost every surprising disk behavior you’ll encounter. Understanding this sequence is the difference between panicking over a disk spike and recognizing it as normal housekeeping.
Here’s the flow, in order:
- Incoming samples land in the head block, an in-memory structure that also gets written to the write-ahead log (WAL) on disk. The WAL exists purely for crash recovery. If Prometheus restarts unexpectedly, it replays the WAL to rebuild the head block instead of losing recent data.
- Every two hours, the head block gets flushed to disk as an immutable block containing chunks (compressed sample data), an index (for fast series lookups), and metadata files.
- Compaction merges smaller two-hour blocks into progressively larger ones, up to a ceiling of 10% of your configured retention time or 31 days, whichever is smaller, according to the Prometheus storage documentation.
That third step is where most confusion starts. During compaction, Prometheus keeps the original source blocks on disk while writing the new, merged block. For a short window, you’re storing the same data twice.
That temporary duplication is a documented, expected behavior, not a leak or a bug. On a server ingesting steadily, this transient overshoot on a busy TSDB can be a real percentage of total disk space, which is exactly why the sizing guidance later in this article leaves a buffer instead of maxing out the disk.
There’s a second wrinkle worth flagging: storage.tsdb.retention.size only counts persisted, compacted blocks. It does not strictly account for the WAL or the in-memory head chunks that haven’t been flushed yet. On high-cardinality or high-throughput servers, that gap between what retention.size tracks and what’s actually consuming disk can be meaningful, which is why disk monitoring needs to watch total directory usage, not just the retention setting itself.
Time-Based vs. Size-Based Retention: Which Flag Do You Need?
Most teams default to time-based retention because it maps to a mental model everyone understands, “keep 30 days,” but size-based retention exists for a reason: disks are finite, and query volume rarely scales predictably with time.
Here’s what each control actually accepts:
storage.tsdb.retention.timetakes a duration with unitsy,w,d,h,m,s, orms(e.g.,45d,6w,1y).storage.tsdb.retention.sizetakes a byte value usingB,KB,MB,GB,TB,PB, orEB, and Prometheus interprets these using power-of-2 semantics, so10GBmeans gibibytes, not decimal gigabytes.- If you set both, whichever threshold triggers first is the one that wins and deletes data. Set both without doing the math first, and you can end up with a shorter effective retention than you intended.
On the configuration side, Prometheus documents several CLI flags related to storage and WAL behavior, but the project has been steadily deprecating flag-based configuration in favor of fields inside the Prometheus config file. That shift matters if you’re managing Prometheus through infrastructure-as-code: a config file field is versioned, diffable, and reviewable in a pull request. A CLI flag buried in a systemd unit or a container entrypoint is much easier to lose track of during an audit.
Our own recommendation, and the practical consensus among teams running Prometheus at scale, is to standardize on config file fields wherever your deployment tooling supports it, and reserve CLI flags for cases the config schema doesn’t cover yet.
If you’re choosing between the two mechanisms: time-based retention is more predictable for compliance and debugging (“we always have 45 days”), while size-based retention is more predictable for infrastructure cost (“we never exceed this disk”). Many production setups use time-based as the primary control and size-based as a safety net.
How Much Disk Do You Need for Your Retention Window?
The 80–85% rule isn’t arbitrary. It exists because compaction temporarily duplicates data on disk, and because the WAL and head chunks sit outside what retention.size actually enforces. Fill your disk to 100% of capacity and a routine compaction cycle can push you into an out-of-disk condition during completely normal operation.
Here’s how to translate that guidance into an actual number:
- Estimate your ingestion rate. Check
prometheus_tsdb_head_samples_appended_totalor your scrape config’s target count times scrape interval to get an approximate samples-per-second figure. - Estimate bytes per sample. Compressed chunks typically land somewhere around 1 to 2 bytes per sample after compaction, though cardinality and label churn push this higher.
- Multiply by your desired retention window in seconds. A server ingesting 50,000 samples/sec at roughly 1.5 bytes/sample over 45 days works out to a rough multi-hundred-gigabyte block footprint before overhead.
- Divide that estimate by 0.80 to 0.85 to back into the disk size you actually need to provision, per the storage documentation’s headroom guidance.
- Add a margin for WAL and head chunk growth, since these aren’t counted by
retention.sizebut still consume real disk.
Pro Tip: Set a disk-usage alert at 75% of total capacity, not 90%. Compaction and WAL growth can consume the remaining 10 to 15% faster than you’d expect on a busy server, and you want a response window before the disk fills, not after.
For ongoing monitoring, watch prometheus_tsdb_storage_blocks_bytes alongside raw filesystem free space. A gap between what Prometheus reports and what df reports is your early signal that WAL or head chunk growth is outpacing block-level accounting.

How Do You Check and Change Prometheus Retention Settings?
Before changing anything, confirm what’s actually running. Prometheus’s web UI, under Status → Runtime & Build Information, shows the active retention values. Programmatically, hit /api/v1/status/flags or /api/v1/status/runtimeinfo to pull the same data into a script or dashboard.
Once you know your baseline, here’s how to change it depending on your deployment:
- Config file (recommended): add or edit the
storage.tsdbfields directly, then reload Prometheus with aSIGHUPor the/-/reloadendpoint if--web.enable-lifecycleis set. - Systemd: update the
ExecStartline’s flags in the unit file, then runsystemctl daemon-reloadfollowed by a service restart. - Containers: update the command args in your Docker Compose file or Kubernetes manifest, whether that’s a raw
StatefulSet, a Prometheus OperatorCustomResourceDefinition, or a managed cluster-monitoring config map.
Pro Tip: Never change retention directly in production first. Push the change to staging, watch compaction run through a full cycle, and confirm disk free space stabilizes before touching the production fleet. A rollback plan here is just reverting the config and reloading, but you want to know that path works before you need it.
What Operational Surprises Should You Plan For?
A few Prometheus behaviors catch experienced engineers off guard, mostly because they’re documented but easy to miss until they cause an incident.
- Enable WAL compression. Introduced in Prometheus 2.11.0 and on by default in newer releases, WAL compression can roughly halve WAL disk usage for many workloads with minimal CPU cost. If you’re running an older version and considering a downgrade after enabling it, check the compatibility notes first, since older Prometheus builds can’t read a compressed WAL.
- Expect delayed cleanup. When a block expires, Prometheus doesn’t delete it instantly. Cleanup of expired blocks can take up to roughly two hours, per the Prometheus GitHub storage documentation. If you shorten retention and expect immediate disk relief, you’ll be watching a slower decline than you anticipated.
- Watch for backfill interactions. If you backfill historical data, entire blocks are retained as long as any single sample inside them falls within the retention window. That can keep more old data around than you’d expect from a simple day-count calculation.
- Monitor the right metrics. Track WAL directory size,
prometheus_tsdb_head_chunks, and total data directory usage as separate signals, not just the aggregateretention.sizefigure.
None of these behaviors are bugs. They’re the predictable result of how compaction and the WAL work, and documenting them internally ahead of time turns a future disk spike into a known event instead of a fire drill.
When Should You Use Remote Storage Instead of Longer Local Retention?
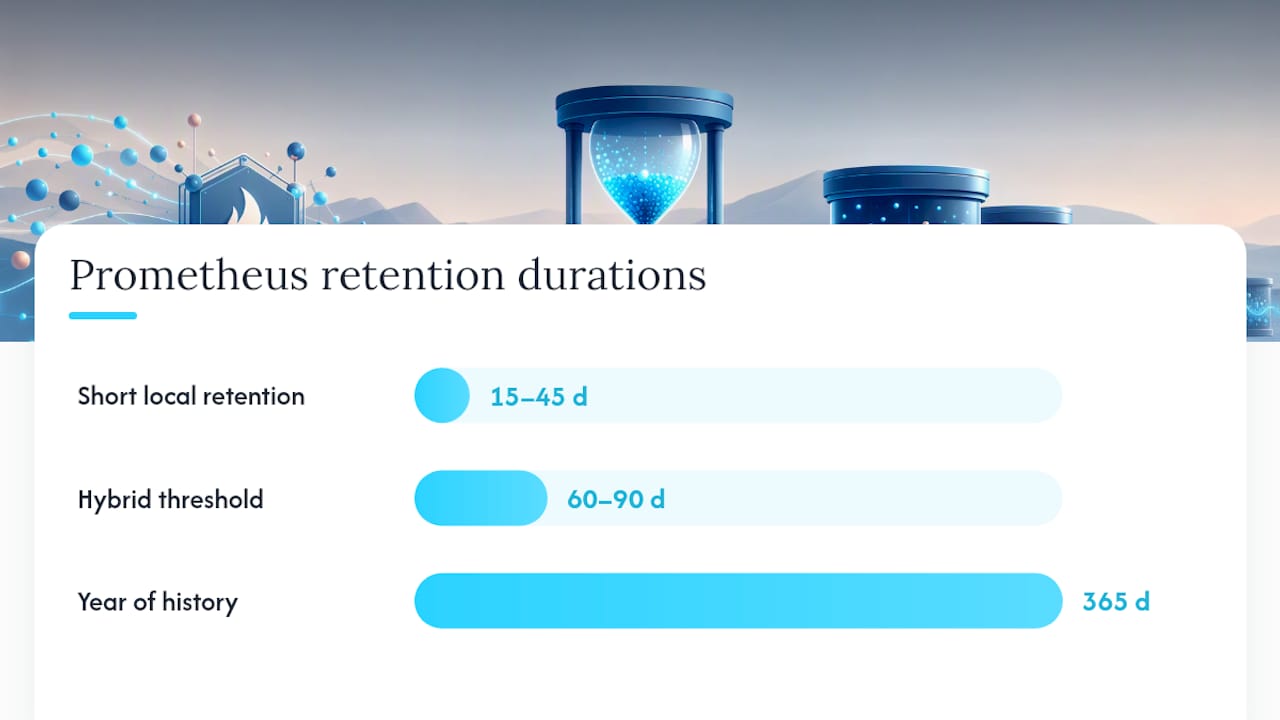
Local retention works well when your query patterns focus on recent data, dashboards, alerting, active incident response, and when your team can tolerate the operational cost of a single-node TSDB. Prometheus’s local storage is explicitly not replicated or clustered, so treat it like any other single-node database: valuable, but not where you want to park your only copy of a year of history.
For anything beyond 60 to 90 days, the better architecture is usually a hybrid one:
- Keep local retention short, often 15 to 45 days, tuned to what your team actually queries day to day.
- Use
remote_writeto ship metrics continuously to a long-term storage system built for horizontal scale and durability. - Accept the trade-offs consciously: remote systems typically add query latency and operational complexity compared to querying local TSDB directly, but they solve the durability and multi-month cost problem local disk can’t.
Projects built around this pattern, compared and contrasted in more detail here, exist specifically to solve long-horizon retention without forcing every Prometheus server to carry a year of blocks locally.
What’s James’s Production Checklist for Changing Retention?
Follow this sequence before touching a production retention flag:
- Audit current state. Pull your samples-per-second rate, current disk usage, and recent WAL peak size. Note when the last compaction cycle ran and how much it grew disk temporarily.
- Test in staging first. Apply the new retention values, then watch a full compaction cycle complete. Confirm disk usage settles where your math predicted, not higher.
- Roll out gradually. Push to a subset of production Prometheus instances if you run more than one, set a disk-pressure alert threshold, and verify
/api/v1/status/flagsreflects the new values. - Reassess if you’re pushing past 60 days. At that point,
remote_writeto long-term storage is almost always the better fix than continuing to grow local disk.
Pro Tip: Keep the old config values in version control with a clear commit message. If disk pressure shows up two weeks later, you want a one-line revert, not a memory exercise.
Balancing forensic value, cost, and operational risk
Every team wants more retention until they’ve watched a query against 90 days of high-cardinality data time out during an actual incident. Short local retention isn’t a compromise. It’s what keeps your query engine fast when you need it most, and it shrinks the blast radius when a single Prometheus instance has a bad day. Remote long-term storage exists for the forensic and compliance use cases, six to twelve months or more, where query speed matters less than durability. Treating those as two different problems, rather than one long retention window, is usually what separates a stable monitoring setup from one that’s one compaction cycle away from a bad afternoon.
— James
Get Your Retention Tuning Right the First Time
Getting the math right on disk headroom and compaction behavior is exactly the kind of one-time setup work that pays off for months, but it eats an afternoon you didn’t budget for. Devopsaitoolkit builds downloadable playbooks and prompt packs specifically for this: TSDB tuning, remote_write automation, and disk-sizing calculators, so you’re not reverse-engineering the math from documentation while a disk alert is firing.

If your retention planning spans more than a handful of Prometheus instances, or you’re architecting the local-plus-remote pattern across a fleet, our consulting and audit services cover exactly that kind of large-scale rollout. For a faster starting point, the Linux admin prompt library includes ready-to-run monitoring and troubleshooting prompts you can adapt today. Check current plans to see which tier fits your team’s scale.
Sources
Recommended
- Prometheus Scrape Config and Relabeling Deep Dive
- Long-Term Prometheus Storage: Thanos vs Mimir, Explained — DevOps AI ToolKit
- Prometheus & Monitoring AI Prompts — 165 Free, Copy-Paste
- Prometheus High Availability and Federation, Done Right
Get 500 Battle-Tested DevOps AI Prompts — Free
500 battle-tested, copy-paste AI prompts engineered by a senior systems engineer — every one with fill-in placeholders and safety/back-out notes. Drop your email and it's yours.
- 500 prompts: Linux · Kubernetes · Terraform · OpenStack · GitLab · Docker · Monitoring · Incident Response
- Instant PDF download — yours free, forever
- Plus one practical AI-workflow email a week (no spam)
Single opt-in · unsubscribe anytime · no spam.