
Getting OpenStack Day 2 Operations Right From the Start
Master OpenStack Day 2 operations with hands-on labs and automation tools to ensure a smooth, efficient cloud environment.

The fastest path to competent OpenStack Day 2 operations is a focused training loop: hands-on labs that mirror real failures, automation practice with tools like Ansible, and certification prep that forces you to prove the skills, not just read about them. Skip straight to production experience without that loop, and you’ll learn your control plane’s failure modes during an outage instead of during a drill, which is a rough way to meet Pacemaker for the first time.
This path works for cloud operators, site reliability engineers, and platform engineers who already survived a Day 1 deployment and now own what happens after. You don’t need to be an OpenStack core contributor. You need repeatable habits.
Here’s the shape of the plan:
- Automation practice with tools like Ansible for rolling upgrades, backups, and drift prevention
- Monitoring fluency with tools like Prometheus and Grafana for telemetry, alerting, and dashboards
- Structured lab work through DevOps AI ToolKit’s guides and playbooks, mapped to specific weekly goals
The rest of this piece walks through what Day 2 actually covers, the exact syllabus to master, how to structure your labs, and an eight-week plan you can start this month.
Key Takeaways
OpenStack Day 2 operations succeed when automation handles routine tasks, monitoring catches drift early, and every recovery procedure gets tested before it’s needed in production.
| Point | Details |
|---|---|
| Automate before you scale | Ansible playbooks for upgrades and backups prevent the drift manual processes eventually create. |
| Test restores, not just backups | A backup you haven’t restored from is a guess, not a safety net. |
| Certification should mirror the job | Hands-on exams covering troubleshooting, upgrades, and playbooks validate more than written tests. |
| Close the loop on incidents | Turn every postmortem into a runbook update or an automated recovery step. |
| Use structured resources to move faster | DevOps AI ToolKit’s guides and playbooks map directly to weekly study goals for Day 2 readiness. |
Primary Documentation and Official Guides to Consult
- OpenStack Operations Guide for backup, RBAC, and general operations best practices
- Manage your OpenStack cloud with Ansible for rolling upgrade and backup playbook patterns
- OpenStack deployment tools listing for Kolla-Ansible and comparable options
- Integrity life cycle guidance for secure provisioning and attestation
Check upstream OpenStack docs for architecture questions, and consult your deployment tool’s own documentation for product-specific commands.
Table of Contents
- What Counts as OpenStack Day 2 Operations?
- What Skills Should an OpenStack Operator Master?
- How Should You Structure Day 2 Training and Labs?
- Which Tools Make Day 2 Operations Repeatable?
- What Certification Should Follow Your Training?
- An 8-Week Study Plan for Day 2 Readiness
- Which Guides Should You Use in Each Study Week?
- Who Should Take This Training, and What Should They Already Know?
- How Do You Validate Skills and Plan Next Steps?
- How Do You Keep Patching and Security Operations on Schedule?
- How Do You Plan Capacity Before You Need It?
- What Does an Incident Management Workflow Look Like?
- How Should You Approach Upgrades and Migrations?
- How Do You Manage Configuration and Prevent Drift?
- How Does OpenStack Fit Into Your Broader Operations Stack?
- Ready to Put This Into Practice?
- Sources
What Counts as OpenStack Day 2 Operations?
Day 1 is the install. Day 2 is everything after, and it never really ends. If Day 1 is building the house, Day 2 is living in it: fixing the leaky pipe at 2 a.m., replacing the roof before it fails, and keeping records of every repair so the next person doesn’t start from zero.
Day 2 operations in cloud environments generally break into six recurring categories:
- Monitoring — tracking service health, resource saturation, and API latency before they become incidents
- Patching and upgrades — applying security fixes and moving between OpenStack releases without breaking tenant workloads
- Scaling — adding compute, storage, or network capacity as demand grows, ideally before anyone notices a shortage
- Backups and restores — protecting Cinder volumes, Ceph pools, and database state, then proving the restore actually works
- Incident response — diagnosing and resolving control plane failures, network partitions, or storage degradation under time pressure
- Troubleshooting — root-causing the recurring weird stuff: a Neutron agent that silently dies, a Nova compute node that reports healthy but schedules nothing
Underneath all six sits a quieter expectation: you maintain runbooks, honor internal SLAs, and keep incident playbooks current enough that someone other than you could follow them during an outage. The OpenStack Operations Guide frames this well: read the operational documentation and build your backup policies and RBAC hierarchies before the emergency, not during it. That single habit shift, proactive instead of reactive, is what separates teams that sleep through pages from teams that don’t.
What Skills Should an OpenStack Operator Master?
You can judge any course, bootcamp, or self-study plan against one question: does it cover these skills with actual hands-on practice, or just slides? Use this checklist to evaluate what you’re considering, including your own gaps.
- CLI proficiency across
openstack server,openstack volume, andopenstack networkcommand families, plus the ability to read raw API responses when the CLI abstracts away the detail you need - Control plane and HA management, including how Pacemaker handles failover and how to verify service health across controller nodes
- Storage fundamentals in Ceph and Cinder: pool status, OSD health, snapshot workflows, and backup verification
- Networking troubleshooting across OVN, OVS, and the broader Neutron stack, including the common failure modes: agent desync, MTU mismatches, and security group rule conflicts
- Identity and RBAC operations in Keystone, covering domains, projects, and least-privilege role assignment
- Monitoring and alerting using Prometheus for metrics, Grafana for dashboards, and centralized log aggregation for correlation during incidents
Pro Tip: Small provisioning details compound at scale. Using a WWN as your root-disk hint during node provisioning prevents a class of boot and disk-selection failures that only shows up once you’re past a handful of nodes, according to Red Hat’s deployment guidance for large environments.
How Should You Structure Day 2 Training and Labs?
The best OpenStack management best practices get learned in a lab that breaks on purpose, not in a lecture hall. Four formats consistently work better than passive reading:
- Instructor-led courses with attached labs, where every concept gets a corresponding exercise the same day it’s taught
- Multi-day, lab-only workshops that skip lecture entirely and put you in front of a broken cluster from hour one
- Self-hosted sandboxes, built on a reproducible lab environment you can destroy and rebuild without asking permission
- Pair-programmed incident drills, where one person injects a fault and the other diagnoses it live, then you swap roles
Before any of that, confirm your prerequisites: basic familiarity with your Day 1 deployment process, a working lab environment that mirrors your production version, and documentation aligned to that specific release. Version drift between your lab and your lecture material wastes hours.
Design your lab scenarios around real failure patterns: rolling upgrades that must not interrupt tenant traffic, a simulated node failure mid-workload, Ceph OSD recovery under load, a deliberate network partition between controller and compute nodes, and a full restore-from-backup exercise timed against a clock. If a scenario can’t happen in production, don’t bother practicing it.

Which Tools Make Day 2 Operations Repeatable?
Manual Day 2 work doesn’t scale, and it doesn’t survive staff turnover either. The tools that actually reduce toil fall into four categories.
- Observability. Prometheus and Grafana cover metrics and dashboards; centralized logging covers the correlation work that dashboards alone can’t do.
- Backup and recovery automation. Playbook-driven Cinder volume backups and Ceph snapshot schedules, restored through the same automation that created them, not through a manual process nobody’s tested since onboarding.
- Lifecycle and integrity practices. Automated provisioning and configuration-management attestation keep nodes running the software and settings you think they’re running, a principle the OpenStack Security Guide’s integrity lifecycle chapter treats as core to reducing drift and supply-chain risk over time.
Ansible in particular earns its reputation here. Example playbooks documented on Opensource show serial rolling updates that pull a node out of the pool, patch it, verify health, and rejoin it, all without touching every node at once. That “serial” pattern is the single automation habit most likely to save you from a self-inflicted outage.
What Certification Should Follow Your Training?
Certification only matters if it validates skills you’ll actually use on-call. The common route is straightforward: complete focused Day 2 training, then sit a hands-on exam or specialist assessment rather than a multiple-choice quiz.
Examiners typically test the same things your labs should have covered:
- Diagnosing and resolving a live control plane or networking fault under a time limit
- Executing and verifying a backup and restore cycle, not just describing one
- Running an upgrade procedure across versions without breaking tenant workloads
- Writing or modifying an automation playbook to fix a stated problem
Passing that kind of exam maps directly to job responsibilities: cloud operator, site reliability engineer, or platform engineer roles that include on-call rotation, incident ownership, and capacity decisions. One useful habit while studying: map every certification objective to a specific lab deliverable, so the thing you demonstrate in your sandbox is the exact skill the exam validates. That alignment, more than any single course, is what makes certification prep feel earned instead of memorized.
An 8-Week Study Plan for Day 2 Readiness
You don’t need six months. You need eight structured weeks and the discipline to actually break things on schedule.
- Weeks 1 and 2: Build your lab environment, review your Day 1 deployment assumptions, and stand up baseline monitoring dashboards so you have something to compare against later.
- Weeks 3 and 4: Write your first Ansible playbooks for routine operations, then test backup and restore cycles until they’re boring instead of terrifying.
- Weeks 5 and 6: Run failure and recovery drills across compute, storage, and network layers, and turn each recovery into a documented runbook while the pain is still fresh.
- Weeks 7 and 8: Sit a mock exam, refine the playbooks that failed under pressure, and build a short reporting demo you could hand to a stakeholder.
Your readiness checklist at the end: one successful rolling upgrade with zero tenant downtime, one documented and verified restore from backup, and active alerting rules that actually fire when they should.
| Point | Details |
|---|---|
| Lab setup comes first | Build a reproducible sandbox before touching any syllabus topic. |
| Automation prevents drift | Ansible playbooks for upgrades and backups reduce configuration drift versus manual changes. |
| Recovery drills beat theory | Practice Ceph OSD failures and network partitions before they happen in production. |
| Certification should map to labs | Each exam objective should match something you already demonstrated in a sandbox. |
Which Guides Should You Use in Each Study Week?
Match publisher resources to your weekly goals instead of reading everything at once. DevOps AI ToolKit’s guides are written for exactly this kind of sprint-based study.
- For weeks 1 and 2, use the Kolla-Ansible deployment guide to build your lab, then the Prometheus and Grafana monitoring guide to get baseline dashboards running. Acceptance criteria: dashboards show live metrics for at least three services.
- For identity and RBAC topics, work through the Keystone debugging guide and confirm you can trace an authentication failure end to end.
- For weeks 7 and 8, the upgrade planning guide walks through the exact rolling-upgrade pattern your mock exam will likely test.
Each guide includes the expected output for its exercise, so you know when you’re actually done versus when you’ve just read to the end.
Who Should Take This Training, and What Should They Already Know?
This training path fits cloud operators, systems administrators, SREs, and platform engineers who already own or will soon own a running OpenStack environment. It’s not an introduction to cloud computing, and it’s not a substitute for understanding what your organization’s OpenStack deployment actually looks like today.
The realistic prerequisite is Day 1 familiarity: you’ve either deployed OpenStack yourself or worked closely enough with the deployment to understand its topology, which services run where, and how the control plane, compute, storage, and networking layers connect. If you’re still fuzzy on the difference between a controller node and a compute node, that gap needs closing before Day 2 training will make sense.
You should also arrive with basic Linux administration skills, comfort with the command line, and at least a passing familiarity with containers if your deployment uses containerized services, which most modern OpenStack deployment strategies do. Teams running Kolla-Ansible deployments, for instance, need operators comfortable reading container logs, not just service logs.
One assumption worth stating plainly: this training assumes you have access to a lab environment, whether that’s a dedicated sandbox, a scaled-down staging cluster, or a cloud-hosted test deployment. Reading about a rolling upgrade teaches you almost nothing compared to running one and watching what breaks. If your organization doesn’t have a spare environment for this, building one is itself a legitimate first exercise, and it’s the same skill you’ll need for testing changes safely once you’re managing production.
Mixed-experience teams benefit from pairing a Day 1 deployment specialist with a newer operator during lab work. The deployment specialist knows why the topology looks the way it does; the newer operator asks the questions that expose gaps in shared runbooks.
How Do You Validate Skills and Plan Next Steps?
Certification is the checkpoint, not the destination. The realistic next step after Day 2 training is a hands-on assessment that mirrors your actual job, not a written test you can pass by memorizing terminology.
Skills validation typically covers four areas in sequence: live troubleshooting of an injected fault, a timed backup and restore cycle, an upgrade procedure executed against a running environment, and a playbook-writing task where you fix or extend existing automation under a deadline. If a certification program skips the hands-on component entirely, treat that as a signal to look elsewhere, because passing a multiple-choice exam tells an employer very little about whether you can recover a degraded Ceph cluster during a maintenance window.
Once certified, the practical next steps split into a few directions depending on your role. Cloud operators typically move into on-call rotation with expanded incident-response authority. SREs use the certification to justify ownership over specific reliability targets, like upgrade cadence or backup verification schedules. Platform engineers often use Day 2 certification as a stepping stone toward designing the automation and tooling standards the rest of the team follows.
Whatever your path, keep treating certification as a periodic checkpoint rather than a one-time achievement. OpenStack releases change frequently enough that skills validated against one release can drift out of date within a couple of major versions, particularly around networking and storage subsystems. Revisit your lab environment and refresh your practice at least once a year, ideally timed to coincide with a version upgrade you’re already planning.
How Do You Keep Patching and Security Operations on Schedule?
Security operations in OpenStack aren’t a separate discipline from Day 2 operations. They’re the same discipline, applied with more urgency. Patch management, in particular, tends to fail not because operators don’t know a fix exists, but because there’s no repeatable process forcing the patch through staging and into production on a schedule.
A workable security operations rhythm has a few consistent elements. First, track upstream security advisories for every OpenStack component you run, not just the ones you touch most often. Second, maintain a staging environment that mirrors production closely enough that a patch tested there tells you something real about how it will behave once deployed. Third, automate the patch rollout itself using the same configuration management tooling you use for routine changes, so patching doesn’t require a manual, error-prone process invented under pressure.
The integrity lifecycle guidance in the OpenStack Security Guide frames this as a continuous loop: automated provisioning, verified boot chains where your hardware supports TPM or Intel TXT, and configuration-management attestation that confirms nodes are actually running what you think they’re running. That last piece matters more than most operators realize. Configuration drift is often invisible until an audit or an incident exposes it, and by then you’re debugging a security gap instead of preventing one.
RBAC hygiene belongs in this same rhythm. Review project and domain-level role assignments on a regular cadence, not just when someone leaves the team. Stale permissions accumulate quietly, and they’re exactly the kind of thing an attacker or a careless script can exploit long after anyone remembers granting them.
How Do You Plan Capacity Before You Need It?
Capacity planning fails most often for a boring reason: nobody’s tracking the trend line until the cluster is already tight. The fix isn’t more infrastructure. It’s a monitoring habit that surfaces growth patterns early enough to act on them.
Start with baseline utilization across compute, storage, and network resources, and track that baseline against growth over weeks and months rather than reacting to daily spikes. Prometheus, paired with Grafana dashboards, gives you the historical view needed to spot a slow creep toward saturation before it becomes an incident. Watching a single point-in-time snapshot tells you almost nothing about whether you have three weeks or three months of headroom left.
For large environments specifically, Red Hat’s guidance on scaling OpenStack deployments recommends validating changes at small scale before rolling them out broadly, including tuning OVN and OVS timeout values as node counts grow. A probe interval that works fine on a twenty-node cluster can start causing false failure detections once you’re past a hundred.
Resource optimization runs in the opposite direction from capacity planning but depends on the same data. Once you know your actual utilization patterns, you can right-size overprovisioned flavors, reclaim abandoned volumes, and identify compute nodes that are consistently underused. This is also where lifecycle management earns its keep: automated lease expiration and VM lifecycle hooks prevent the kind of resource sprawl where nobody remembers who owns an instance that’s been idle for four months. Building that reclamation logic into your automation, rather than doing it manually during a quarterly cleanup, keeps utilization numbers honest year-round.
What Does an Incident Management Workflow Look Like?
A good OpenStack incident workflow doesn’t start when the page fires. It starts with the monitoring and alerting rules you built weeks earlier, and it ends with a runbook update that makes the next incident shorter than this one.

The workflow itself typically has five stages. Detection comes first, usually through an alert tied to a specific threshold rather than a user complaint, which means your alerting rules need to be tuned tightly enough to catch real problems without drowning the on-call operator in noise. Triage follows immediately: is this a control plane issue, a compute failure, a storage degradation, or a network partition? That classification determines which runbook applies and who needs to be looped in.
Diagnosis is where troubleshooting skill actually gets tested, and it’s also where good tooling pays for itself. An operator who can quickly correlate logs, metrics, and recent configuration changes resolves an incident in minutes; one working from scattered dashboards and no centralized logging can burn hours on the same problem. Resolution comes next, ideally executed through an existing playbook rather than improvised commands typed under pressure. And finally, the postmortem: what failed, why, and what changes to the runbook or automation prevent a repeat.
That last stage is the one teams skip most often, and it’s the one that compounds. Design lab scenarios around realistic failure modes, whether that’s a rolling upgrade gone wrong, a Ceph OSD failure, or a networking timeout, and build the recovery steps directly into playbooks so the postmortem’s recommendations become executable procedures instead of a bullet point nobody revisits.
How Should You Approach Upgrades and Migrations?
Upgrades are where Day 2 operations gets the most nerve-wracking, and for good reason: a botched upgrade can take down tenant workloads across an entire environment at once. The fix is treating every upgrade as an automation problem first and a manual procedure only as a last resort.
Version compatibility is the first checkpoint. Before touching production, confirm that every service you run has a documented, supported upgrade path between your current release and your target release, and that any API or configuration changes between versions are accounted for in your automation. Skipping this step is how operators discover, mid-upgrade, that a Neutron configuration option they depend on was renamed two releases ago.
Downtime minimization comes down almost entirely to how you sequence the upgrade. The rolling-upgrade pattern documented in Ansible playbooks on Opensource pulls one node out of service, patches it, verifies health, and rejoins it before moving to the next, using Ansible’s serial directive to control how many nodes are touched at once. That pattern keeps enough capacity online throughout the process that tenant workloads never notice the maintenance window.
For large-scale environments, validate every upgrade step at small scale before applying it broadly. Red Hat’s guidance on large deployments specifically recommends limiting the number of nodes per deployment batch and testing heat template changes against a small subset first, catching a bad template before it touches your whole fleet rather than after.
How Do You Manage Configuration and Prevent Drift?
Configuration drift is the quiet failure mode of Day 2 operations. No single change causes an outage, but months of small, undocumented manual edits eventually leave you with a cluster that no longer matches its own documentation, and nobody can say with confidence why a given node behaves differently from its neighbors.
State reconciliation is the practice that fixes this: your configuration management tooling should regularly compare a node’s actual running state against its declared configuration and correct any divergence automatically, rather than assuming a config file applied once stays accurate forever. Ansible playbooks handle this well when run on a schedule rather than only during initial deployment, treating configuration as something to continuously enforce, not a one-time task.
The deeper principle here comes from integrity lifecycle practices: automated provisioning paired with configuration-management attestation of expected state, so any node running software or settings that don’t match policy gets flagged rather than discovered by accident during an incident. This matters especially for compute nodes and network agents, where a single manually patched service can behave inconsistently with everything else in the fleet.
Practically, this means version-controlling every playbook and configuration template, running drift-detection scans on a regular schedule, and banning manual production changes outside of your automation pipeline except in genuine emergencies, and even then requiring the change to be back-ported into the playbook afterward. The goal isn’t zero manual intervention ever. It’s making manual intervention the rare exception that gets reconciled quickly, not the default way things get done.
How Does OpenStack Fit Into Your Broader Operations Stack?
OpenStack rarely runs in isolation. Most production environments need it talking to external logging systems, alerting platforms, and a configuration management database that tracks what’s actually running where.
Logging integration usually means shipping OpenStack service logs, Nova, Neutron, Cinder, Keystone, into a centralized aggregation system rather than leaving them scattered across individual nodes. That centralization is what makes correlation possible during an incident. When a networking failure and a compute scheduling error show up in the same five-minute window, centralized logs let you connect them; scattered logs on individual hosts almost guarantee you miss the connection until it’s obvious in hindsight.
Alerting integration extends your Prometheus and Grafana setup outward, routing threshold breaches into whatever paging or notification system your team already uses. The goal is one alerting pipeline your team trusts, not five overlapping tools that each fire slightly different versions of the same warning.
CMDB integration is the piece teams skip most often, and it’s usually the one they regret skipping. Keeping an accurate, automatically updated record of which nodes run which services, which versions, and which configurations, gives you a single source of truth during incident triage instead of a scramble to figure out what’s actually deployed. Tying your CMDB updates into the same automation that handles deployments and upgrades keeps that record honest without requiring anyone to update it manually after every change.
None of these integrations are exotic. They’re the connective tissue that turns isolated Day 2 tasks into something that functions as actual cloud infrastructure operations, rather than a collection of disconnected tools each doing their own job in the dark.
Ready to Put This Into Practice?
Reading a syllabus and running one in your own environment are two different things, and that gap is exactly where DevOps AI ToolKit fits. Instead of piecing together scattered blog posts and outdated forum threads, you get vetted playbooks, lab exercises, and automation templates built specifically around the Day 2 tasks covered above: rolling upgrades, backup verification, drift detection, and incident drills.
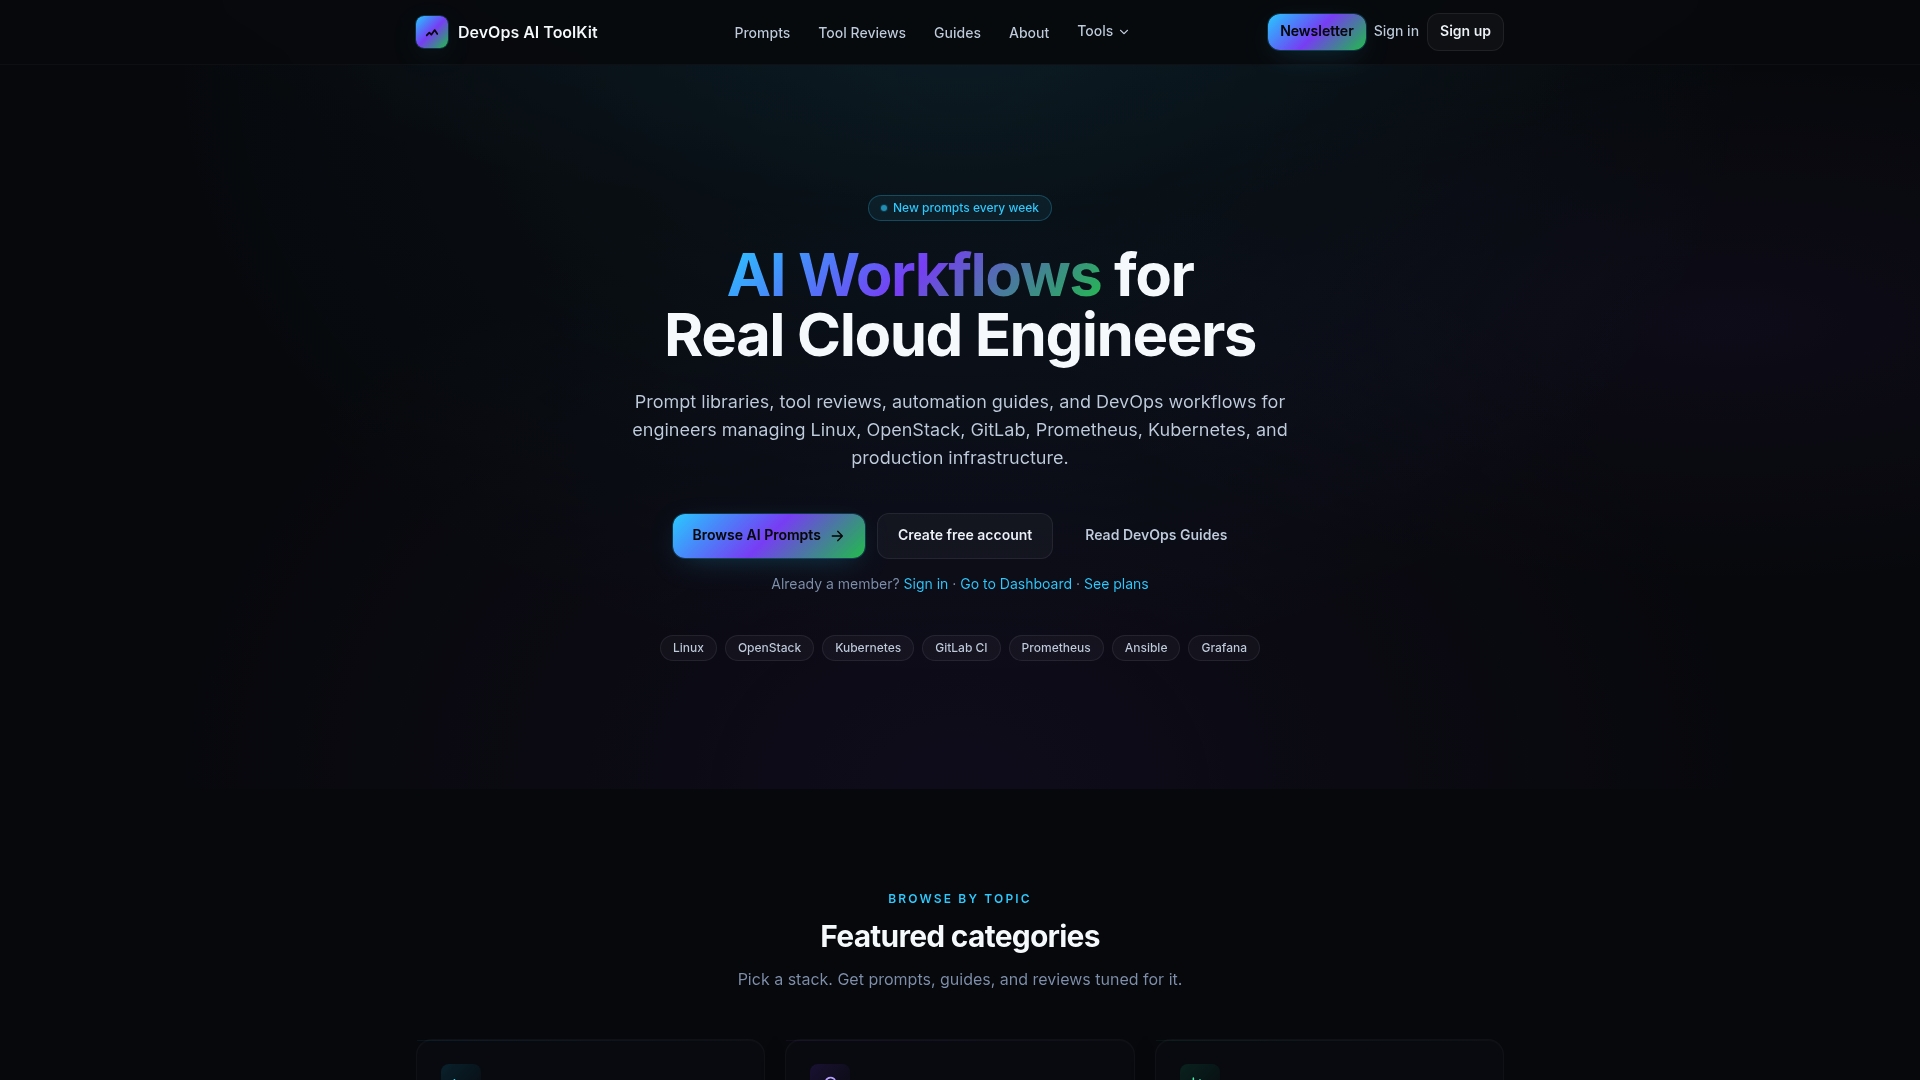
Each resource maps directly onto the eight-week plan. Setting up monitoring in weeks one and two takes a fraction of the time when you’re starting from a tested Prometheus and Grafana configuration instead of building one from scratch. Writing your first Ansible playbooks in weeks three and four goes faster with templates already structured around serial rolling updates and backup restores. If your team needs a faster path than self-study, consulting engagements and tailored infrastructure audits can shortcut the drift-detection and incident-workflow work covered in the later weeks.
Browse the AI DevOps Tools page for the full catalog of playbooks and prompt kits, or check current pricing to see which package fits your team’s scope. If you’re not sure where your gaps are yet, that’s a reasonable place to start the conversation.
A Short Note on What Actually Matters
The single most valuable first lab exercise is a forced restore from backup, not a rolling upgrade. If your restore fails, nothing else in your runbook matters yet.
Sources
- OpenStack Operations Guide
- Opensource
- OpenStack deployment tools — OpenStack Project Navigator
- Integrity life cycle — OpenStack Security Guide
Recommended
- How to Build a Production-Ready OpenStack Cloud (2026 Guide)
- Debugging Heat Orchestration Stacks in OpenStack
- OpenStack Architecture: A Practitioner’s Technical Guide
Get 500 Battle-Tested DevOps AI Prompts — Free
500 battle-tested, copy-paste AI prompts engineered by a senior systems engineer — every one with fill-in placeholders and safety/back-out notes. Drop your email and it's yours.
- 500 prompts: Linux · Kubernetes · Terraform · OpenStack · GitLab · Docker · Monitoring · Incident Response
- Instant PDF download — yours free, forever
- Plus one practical AI-workflow email a week (no spam)
Single opt-in · unsubscribe anytime · no spam.