Infrastructure Monitoring Explained for Cloud Engineers
Discover how infrastructure monitoring explained can enhance system health and performance. Learn key strategies for proactive incident prevention.

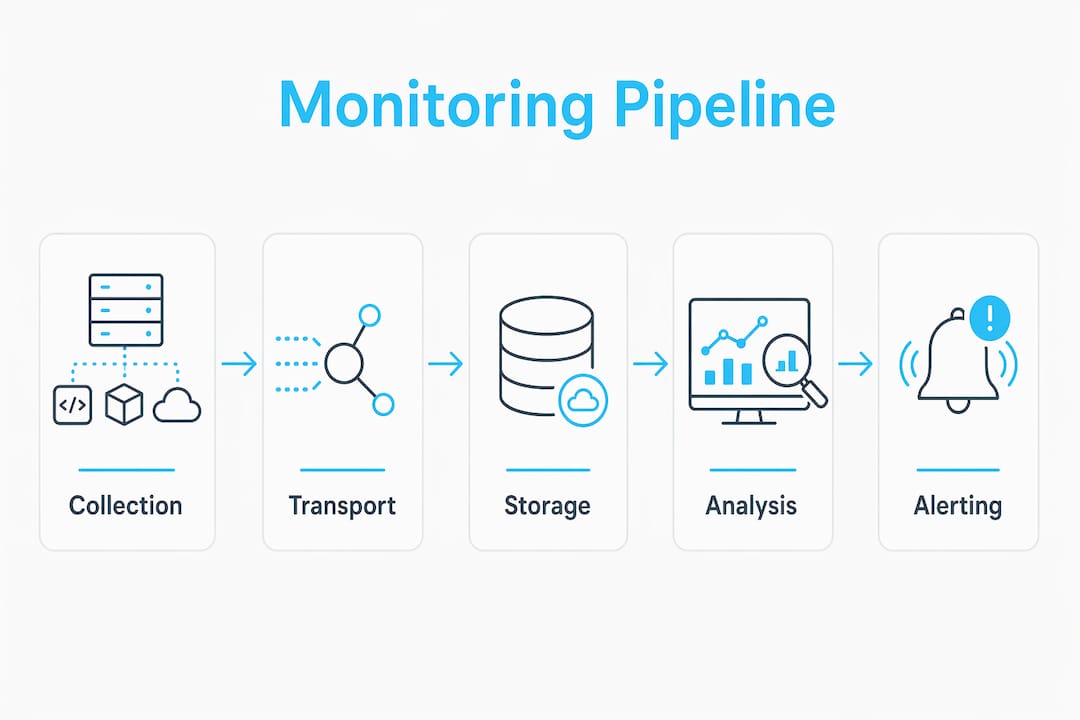
Infrastructure monitoring is the continuous process of collecting, analyzing, and interpreting telemetry from compute, network, storage, and orchestration layers to maintain system health, performance, and availability. The industry term for this practice is IT infrastructure monitoring, and it operates through a four-stage data pipeline: collection, transport, storage and indexing, and alerting with action. Service Level Objectives (SLOs), time-series databases, and distributed tracing frameworks are the core building blocks of any modern monitoring setup. Without this pipeline running continuously, you are flying blind in production. Teams that get this right shift from reactive firefighting to proactive incident prevention, which is the real goal of infrastructure performance tracking.
What is infrastructure monitoring and what does it cover?
Infrastructure monitoring covers every layer of your IT stack. Compute resources like virtual machines and containers, network devices, storage systems, and orchestration platforms like Kubernetes all generate telemetry that needs to be captured and correlated.
The three primary data types are metrics, logs, and distributed traces. Metrics are numeric time-series values such as CPU utilization or memory pressure. Logs are structured or unstructured event records from applications and system daemons. Traces track a request as it moves across services, making them critical for diagnosing latency in microservices architectures.

Two collection methods dominate the field. Agent-based collection installs software directly on the host, giving you granular, high-frequency data. Agentless collection uses remote protocols like SSH, SNMP, and WMI, which reduces deployment overhead but provides less depth. The right choice depends on your environment’s security posture and your team’s operational capacity.
Collection intervals matter more than most engineers realize. Critical systems use seconds-level intervals while less critical components use minute-level intervals. Shorter intervals improve resolution for incident diagnosis but increase storage costs significantly.
| Dimension | Agent-based | Agentless |
|---|---|---|
| Data depth | High, host-level granularity | Moderate, protocol-limited |
| Deployment effort | Higher, requires host access | Lower, remote protocols |
| Typical interval | 1–15 seconds | 30–60 seconds |
| Best for | Production servers, containers | Network devices, legacy systems |
- Compute: CPU, memory, disk I/O, process counts on VMs and bare metal
- Network: bandwidth, packet loss, latency, interface errors
- Storage: IOPS, throughput, capacity utilization, error rates
- Orchestration: pod states, node pressure, deployment health in Kubernetes
How does infrastructure monitoring work: the pipeline in detail?
The four-stage pipeline is the engine behind every monitoring system. Understanding each stage helps you diagnose gaps in your own setup.
- Collection. Agents or APIs pull telemetry from hosts, containers, and cloud APIs. Prometheus scrapes metrics endpoints. Fluent Bit or Fluentd ship logs. OpenTelemetry SDKs instrument applications for distributed traces. This stage defines the fidelity of everything downstream.
- Transport. Data moves from collection agents to a central aggregation point. Message queues or streaming platforms handle high-volume log pipelines. Metrics often travel via pull-based HTTP scrapes or push-based remote write protocols.
- Storage and indexing. Time-series databases like Prometheus TSDB or VictoriaMetrics store metrics. Elasticsearch or Loki indexes logs. Tempo or Jaeger stores traces. Each storage backend is optimized for its data type, which is why mixing them into a single flat database kills query performance.
- Alerting and action. Threshold-based alerts fire when a metric crosses a static value. SLO-based alerting fires when your error budget burns too fast, which is a far more meaningful signal for on-call engineers.
Correlating across all three data types is where modern monitoring earns its value. Minimizing Mean Time To Repair (MTTR) requires three-way correlation linking metrics, logs, and traces within the same time window. Without that correlation, you jump between tools manually, and minutes of context-switching add up fast during an incident. Platforms that support linking metrics to traces via Prometheus exemplars cut that diagnostic time from minutes to seconds.
Pro Tip: AI-driven alert noise suppression routes alerts based on service impact rather than raw threshold breaches. This single change reduces alert fatigue more than any tuning of static thresholds.
What are the benefits of infrastructure monitoring in hybrid cloud?
Proactive detection is the primary benefit. Teams that adopt SLO-based monitoring move from reacting to incidents after users notice them to catching error budget burns before they breach SLA thresholds. That shift directly improves user experience and reduces the cost of outages.
Hybrid IT environments create a specific challenge: fragmented visibility. Disparate tooling across on-premises, edge, and multi-cloud creates blind spots that slow root cause analysis and create operational bottlenecks. A unified monitoring platform that ingests telemetry from all environments into a single query interface solves this directly.
Cost optimization is an underrated benefit. When you can see storage IOPS, compute utilization, and network throughput in one place, you can right-size resources with data instead of guesswork. Teams that lack this visibility tend to overprovision out of caution.
Best practices for hybrid cloud monitoring:
- Adopt unified visibility. Use a single platform that covers on-premises, Kubernetes, and cloud APIs rather than three separate tools that never talk to each other.
- Set SLOs before writing alerts. Define what “good” looks like for each service, then build alerts that fire when you are burning toward a breach.
- Use anomaly detection. Static thresholds miss gradual degradation. Anomaly detection catches trends before they become outages.
- Automate remediation for known failure modes. Runbooks triggered by alerts reduce toil and mean your team handles novel problems, not repetitive ones.
- Audit your alert inventory quarterly. Alert fatigue kills on-call effectiveness. Remove alerts that have never triggered a meaningful response.
Pro Tip: SLO-driven alerting with error budget burn rates gives on-call engineers context that a raw CPU alert never can. It tells you not just that something is wrong, but how fast you are running out of time to fix it.
How to choose and implement infrastructure monitoring tools
The most effective monitoring tool fits your team’s operational strategy, not just your feature wishlist. Operational strategy should guide tool choice more than feature checklists. A two-person SRE team and a 50-person platform engineering org have fundamentally different needs, and the same enterprise platform that works for one will crush the other with operational overhead.
Two broad approaches dominate the market. SaaS-first observability platforms handle infrastructure, scaling, and retention for you. You pay a premium for that convenience. Open-source assembly, combining Prometheus, Grafana, Loki, and Tempo, gives you full control and no vendor lock-in, but your team owns every upgrade, backup, and capacity decision.
Pricing models deserve serious scrutiny before you sign anything. Cardinality taxes and per-metric fees can surprise teams that ingest high-cardinality Kubernetes labels. Node-based or compute-based pricing with volume discounts is far more predictable for production environments.
| Approach | Cost model | Control | Complexity | Best for |
|---|---|---|---|---|
| SaaS observability | Per-host or per-metric | Low | Low | Teams with limited ops bandwidth |
| Open-source assembly | Infrastructure cost only | High | High | Teams with strong platform engineering |
| Hybrid (managed OSS) | Mixed | Medium | Medium | Mid-size teams scaling fast |
Monitoring maturity follows a predictable path. Most teams start reactive, alerting only on outages. The next stage is proactive, using SLOs and anomaly detection. The mature stage is unified observability, where metrics, logs, and traces are correlated automatically and the system surfaces root causes rather than symptoms.
Integrate monitoring into your existing DevOps workflows from day one. Alerts should feed your incident management system. Dashboards should live in the same place engineers check deployment status. Monitoring OpenStack with Prometheus and Grafana is a practical example of wiring open-source tooling into a production cloud without rebuilding your entire workflow.
Pro Tip: Before committing to any platform, run a 30-day proof of concept with your actual production cardinality. Pricing surprises almost always surface in that first billing cycle, not in the sales demo.
Key Takeaways
Effective infrastructure monitoring requires a complete pipeline from collection to alerting, with SLO-based thresholds and three-way telemetry correlation as the foundation for fast incident resolution.
| Point | Details |
|---|---|
| Four-stage pipeline | Every monitoring system runs collection, transport, storage, and alerting in sequence. |
| Three-way correlation | Linking metrics, logs, and traces in the same time window minimizes MTTR. |
| SLO-based alerting | Error budget burn rates give on-call engineers more context than raw threshold alerts. |
| Unified visibility | A single platform across hybrid environments eliminates blind spots and speeds root cause analysis. |
| Pricing model scrutiny | Cardinality-based fees can cause budget overruns; node-based pricing is more predictable. |
Where infrastructure monitoring is heading in 2026
The shift to Autonomous IT is the most significant change I have seen in this space in years. Unified visibility across on-premises, edge, and multi-cloud is no longer a nice-to-have. It is the baseline expectation for any team running production workloads across more than one environment. The tool silos that were acceptable in 2020 are now the primary cause of slow incident resolution.
The mistake I see most often is teams conflating monitoring with observability. Monitoring tracks known metrics against thresholds. Observability enables troubleshooting unknown issues by correlating metrics, logs, and traces, often using eBPF kernel tracing for deep visibility without code changes. These are complementary, not interchangeable. You need both, and you need to know which one you are doing at any given moment.
Alert overload is still the most common operational failure I encounter. Teams instrument everything, set thresholds on every metric, and then wonder why their on-call rotation burns people out. The fix is not more tooling. It is fewer, better alerts tied to SLOs that reflect actual user impact.
My practical advice for teams implementing or upgrading monitoring in 2026: start with your SLOs, not your dashboards. Define what reliability means for each service before you write a single alert rule. Then build your collection and alerting pipeline to serve those definitions. That sequence sounds obvious, but most teams do it backwards and spend months tuning noise instead of preventing incidents.
— James
Monitoring workflows built for production engineers
Cloud engineers managing Prometheus, Kubernetes, OpenStack, and GitLab need monitoring workflows that fit how they actually work, not generic playbooks written for a theoretical stack.
Devopsaitoolkit publishes AI-driven monitoring workflows built specifically for production infrastructure. The prompt libraries, automation guides, and tool reviews cover real scenarios: reducing MTTR with three-way telemetry correlation, translating SLO requirements into PromQL, and wiring distributed tracing into existing Prometheus setups. If you are building or upgrading your monitoring stack in 2026, these workflows cut the time from “we have a problem” to “we know why” significantly.
FAQ
What is infrastructure monitoring in simple terms?
Infrastructure monitoring is the continuous collection and analysis of telemetry from servers, networks, storage, and containers to detect performance issues and prevent outages before users notice them.
What is the difference between monitoring and observability?
Monitoring tracks known metrics against defined thresholds. Observability correlates metrics, logs, and traces to diagnose unknown issues, often using technologies like eBPF and distributed tracing.
What are the main infrastructure monitoring best practices?
Set SLOs before writing alerts, use unified platforms for hybrid visibility, adopt anomaly detection for gradual degradation, and audit your alert inventory regularly to prevent alert fatigue.
How do infrastructure monitoring tools handle hybrid cloud environments?
Unified platforms ingest telemetry from on-premises, edge, and multi-cloud sources into a single interface, eliminating the blind spots created by running separate tools for each environment.
What should I watch for when evaluating infrastructure monitoring tools?
Scrutinize the pricing model before committing. Cardinality-based or per-metric fees can cause unexpected costs at scale. Node-based pricing with volume discounts is more predictable for production environments.
Recommended
- Pricing — DevOps AI ToolKit
- Monitoring-as-a-Service with OpenStack Monasca and AI
- Monitoring OpenStack with Prometheus and Grafana — DevOps AI ToolKit
- Catching the Silent Degradation Your Monitoring Misses
Download the Free 500-Prompt DevOps AI Toolkit
500 battle-tested, copy-paste AI prompts engineered by a senior systems engineer — every one with fill-in placeholders and safety/back-out notes. Drop your email and it's yours.
- 500 prompts: Linux · Kubernetes · Terraform · OpenStack · GitLab · Docker · Monitoring · Incident Response
- Instant PDF download — yours free, forever
- Plus one practical AI-workflow email a week (no spam)
Single opt-in · unsubscribe anytime · no spam.