
SREs: Wire AI Runbooks into Incident Triage Workflow in Two Minutes
Practical guide for SREs: wire runbooks into Alertmanager, use AI to surface runbooks, pre-fill incident channels, and cut triage time to two minutes.

Run a Detect → Triage → Mitigate → Resolve → Postmortem workflow, and make triage itself as fast as possible: acknowledge the alert, open the incident channel, assign an Incident Commander, and open the matching runbook all within the first two minutes. The workflow only gets fast when runbooks are wired directly into your alerts and roles are defined before the pager goes off, not during the fire.
TL;DR:
- Linking alert annotations to specific runbooks saves valuable triage time by providing direct decision trees and context during incidents.
- Automating diagnostic checks before human intervention, such as pod health and resource usage, speeds up triage without risking unapproved fixes.
- Assigning roles based on expertise and establishing silent handoffs helps teams avoid delays and re-diagnosis during incident response.
- Postmortems within 48 hours and regular runbook updates ensure lessons are retained and procedures stay relevant under pressure.
- AI can assist by surfacing relevant runbooks and pre-filling diagnostic steps but should never execute fixes without human approval.
Table of Contents
- What Does an Incident Triage Workflow Actually Look Like?
- How Do You Wire Alerts Directly to Runbooks?
- Who Should Own Each Decision During Triage?
- What Automation Actually Speeds Up Triage Safely?
- How Do You Close Out an Incident Without Losing the Lesson?
- Where AI Actually Helps (And Where It Shouldn’t Touch Anything)
- Build Your Triage Workflow Faster With Devopsaitoolkit
- Sources
What Does an Incident Triage Workflow Actually Look Like?
The five-stage cycle, detect, triage, mitigate, resolve, postmortem, is the backbone most SRE teams build their incident triage process around, and for good reason: it forces a decision at every handoff instead of letting an incident drift. Detection is automated. Triage is where humans decide what matters. Everything after that is execution.
The first five minutes of any incident triage checklist decide whether you’re fighting the right fire or chasing a red herring. Here’s the ordered sequence to run every time a page lands, no exceptions for “obvious” alerts.
- Acknowledge the alert in PagerDuty immediately. This stops escalation timers and buys you room to think without a second page stacking on top.
- Open the incident channel and post a one-line status. Something like “Investigating elevated 5xx on checkout-api, SEV2 pending” gives stakeholders a heartbeat before you have answers.
- Check the Grafana error-rate panel for the affected service. A healthy baseline is a flat line near zero; anything spiking above your SLO burn threshold confirms real impact.
- Cross-reference recent deploys. Run
git log --since="30 minutes ago"or check your GitLab pipeline history. Most production incidents trace back to a change in the last hour. - Check pod health with
kubectl get pods -n <namespace>and look forCrashLoopBackOff,Pending, or high restart counts. Healthy output shows all podsRunningwith0or low restart counts. - Run a quick resource check (
kubectl top pods,kubectl top nodes) to rule out CPU or memory exhaustion before you go digging into application logs.
Once you have that picture, classify severity. A working matrix looks like this:
- SEV1: Customer-facing outage, revenue-impacting, or data integrity at risk. Declare immediately, page additional responders.
- SEV2: Degraded performance or partial feature failure. Declare an incident, single on-call engineer can usually handle triage alone.
- SEV3: Internal-only or cosmetic issue. Log it, fix during business hours, no incident channel needed.
Escalate the moment you can’t identify a probable cause within five minutes, or the moment metrics cross a SEV1 threshold. Assign the Incident Commander role at declaration, not after ten minutes of solo debugging.
Pro Tip: Keep a “known healthy” snapshot of kubectl top nodes and your core Grafana dashboards pinned somewhere the whole team can find fast. Comparing against a stale mental baseline wastes more triage time than almost anything else.
How Do You Wire Alerts Directly to Runbooks?
A runbook that isn’t linked from the alert that fires it is just documentation nobody reads under pressure. The fix is structural: every Prometheus alert should carry a runbook_url annotation, and Alertmanager should render that link, plus pod, namespace, and dashboard context, directly into the notification.
Build every runbook as an executable decision tree, not a wall of prose. The pattern that holds up under pressure has five parts:
- Alert context: what fired, which service, what threshold was crossed.
- Confirm: exact commands to run, with the expected healthy output listed next to each one so responders aren’t guessing what “normal” looks like.
- Causes and actions: the two or three most common root causes for this specific alert, ranked by frequency.
- Mitigate: the immediate stabilization step, rollback, scale-up, circuit breaker, whatever buys time.
- Follow-up: what to check once things stabilize, and where to log findings.
The Google SRE Book’s guidance on managing incidents makes the same point from a different angle: customizing Alertmanager templates to inject direct Kubernetes event logs and dashboard links can cut tool-switching by 60% compared to engineers manually navigating between consoles during an active incident. That’s minutes back in every single page.
Annotating alerts correctly matters as much as writing the runbook itself. The kubernetes-mixin project’s runbook documentation recommends keeping a dedicated runbook_url per alert family, not a generic wiki homepage, so responders land on the exact decision tree for that failure mode instead of a table of contents.
Noise control is the other half of wiring alerts correctly. Alertmanager’s group_by, group_wait, and group_interval settings collapse related alerts (say, twelve pods flapping in one deployment) into a single notification instead of twelve separate pages. Pair that with inhibit_rules so a node-down alert automatically suppresses the dozen pod-unreachable alerts it triggers downstream. Configuring Alertmanager 0.27’s template functions correctly against Prometheus 2.50 reduces both mean time to acknowledge and unnecessary scrape overhead when service discovery is tuned for your cluster size.
Want a starting point instead of building templates from scratch? Devopsaitoolkit’s Alertmanager notification templates prompt handles the runbook and dashboard injection pattern directly.
Who Should Own Each Decision During Triage?
Assign roles by who actually knows the failing system best right now, not by who’s most senior on the org chart. A staff engineer with zero Kubernetes networking experience is the wrong person to lead triage on a CNI failure, full stop.
The core roles that need to exist for any incident above SEV3:
- Incident Commander (IC): owns the decision to mitigate, escalate, or roll back. Nobody else authorizes production changes during an active incident.
- Ops Lead: the hands-on-keyboard responder actually running diagnostics and applying fixes.
- Communications Lead: owns the incident channel updates and any external status page, so the IC isn’t context-switching between fixing and reporting. Devopsaitoolkit’s breakdown of the communications lead role covers update cadence in more detail.
- Scribe: logs the timeline in real time, because nobody reconstructs an accurate timeline from memory two days later.
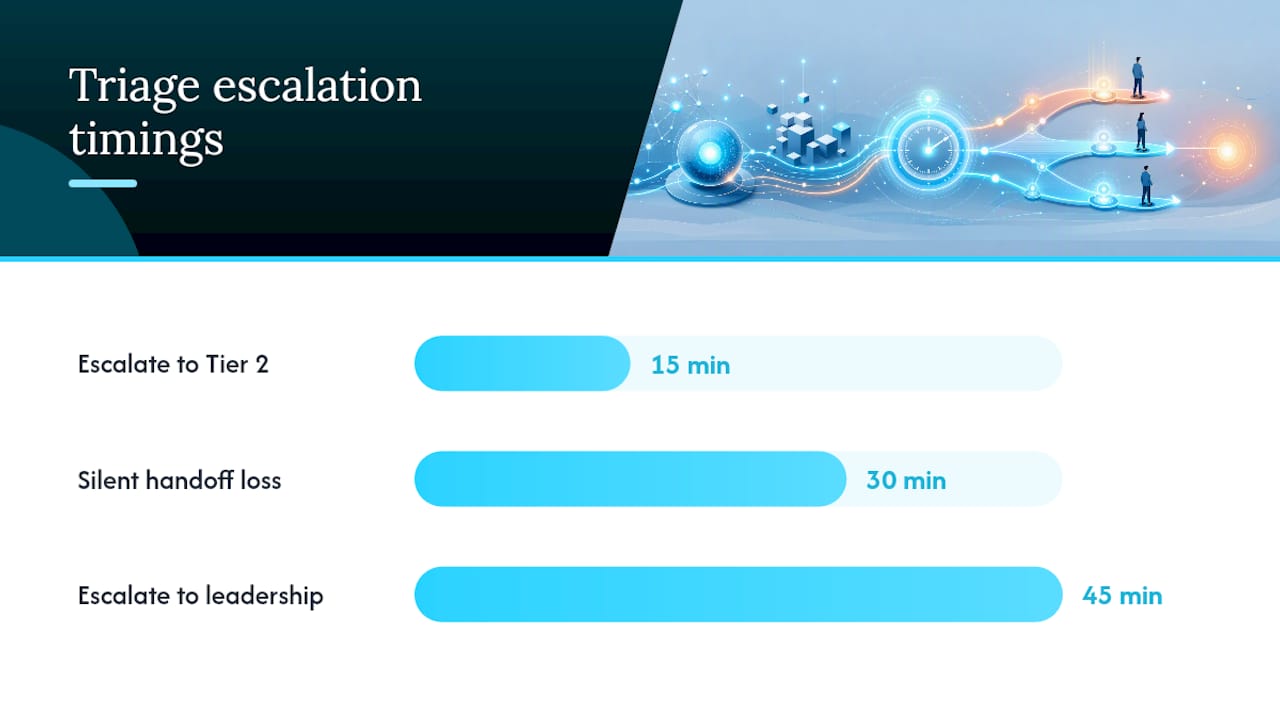
Handoffs matter as much as the initial assignment. When an incident crosses a shift boundary, the outgoing IC gives a verbal summary, current hypothesis, actions taken, actions pending, before the incoming IC accepts the role in the channel. Silent handoffs are how teams lose thirty minutes re-diagnosing something already ruled out.
Build a time-based escalation ladder into your process: escalate to Tier 2 if root cause isn’t identified within 15 minutes, and to engineering leadership if a SEV1 remains unresolved past 45 minutes. Reserve IC-only authorization for anything irreversible: production rollbacks, deploy freezes, or invoking a broader disaster recovery plan.
What Automation Actually Speeds Up Triage Safely?
Automate the diagnosis, never the fix, at least not without a human signing off first. That single rule separates automation that accelerates triage from automation that causes a second incident.
The pattern that works in practice:
- Pre-fill the incident channel automatically the moment a SEV1 or SEV2 fires, dashboard links, recent deploy metadata, and affected service names posted before the on-call engineer even opens their laptop.
- Trigger a diagnostic job through a webhook, PagerDuty firing to Rundeck or Ansible, that runs read-only checks (pod status, recent logs, resource utilization) and posts results directly into the channel.
- Template the Alertmanager payload to include direct links to Loki or Elasticsearch log queries scoped to the affected namespace, not just a generic Kibana homepage.
- Test every template change in a staging Alertmanager instance before deploying, since a broken template silently drops context exactly when you need it most.
Structured playbooks that pair automated diagnostics with clear human checkpoints are becoming standard practice across SRE teams, and the safety rule stays consistent across every implementation worth adopting: automation runs read-only checks by default, and any action that mutates production, restarting a deployment, scaling a node pool, rolling back a release, requires explicit IC approval. That’s the line described in current SRE incident response playbook patterns, and it’s also the pattern covered in Devopsaitoolkit’s guide to AI-assisted runbook selection, where AI narrows down the likely runbook without ever executing the fix itself. A useful external framing of similar automation boundaries comes from Agent-swarm.
Pro Tip: If your diagnostic webhook can post a Grafana snapshot image directly into the incident channel, do it. A visual spike is processed faster than a responder mentally translating a number into a shape.
How Do You Close Out an Incident Without Losing the Lesson?
Verify before you declare victory. Watch the affected metrics through at least one full monitoring window, confirm no re-alerts fire, and check that customer-facing impact has actually cleared, not just that the dashboard looks quiet for five minutes.
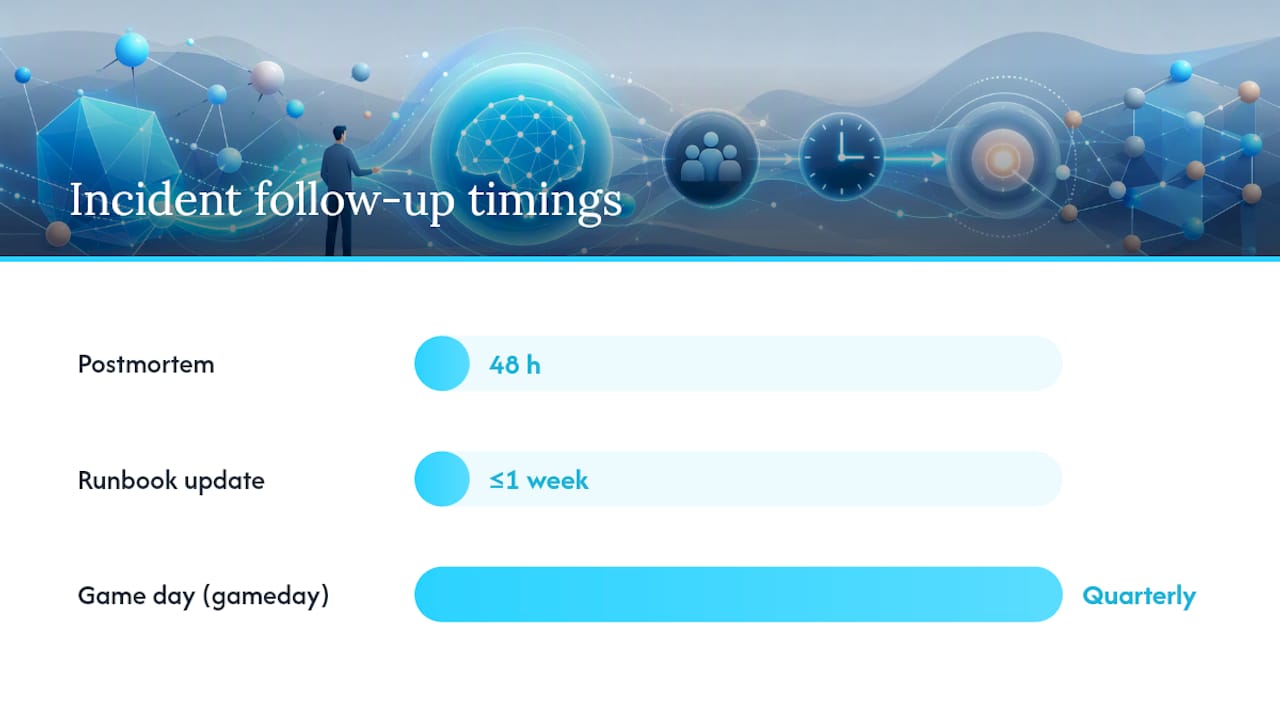
Run the postmortem within 48 hours, while details are still fresh, using a consistent template:
- Summary: what happened, in two sentences a non-engineer could understand.
- Timeline: pulled from the scribe’s real-time log, timestamped to the minute.
- Root cause: the actual mechanism, not just “a bad deploy.”
- What went well / what went poorly: blameless, focused on process gaps, not individual mistakes.
- Action items: each with a named owner and a due date, tracked to closure like any other engineering ticket.
Devopsaitoolkit’s guide to building incident timelines from Prometheus data shows how to reconstruct that timeline automatically instead of piecing it together from Slack scroll-back.
Two follow-up habits keep runbooks from rotting:
- Update the runbook that fired within the same week, while the gap between “what the runbook said” and “what actually happened” is still obvious.
- Schedule a game day quarterly to walk through high-traffic runbooks under simulated conditions, a practice documented in open-source runbook collections as one of the highest-leverage ways to keep procedures usable under real pressure.
Tie every postmortem back to your error budget. If a SEV1 burned a meaningful chunk of your monthly budget, that’s the trigger to freeze risky deploys or add on-call staffing, not a decision to make case by case.
Where AI Actually Helps (And Where It Shouldn’t Touch Anything)
Most of the incident triage steps above aren’t new ideas. What’s changed is how fast you can execute them, and that’s where AI-assisted workflows earn their place instead of just being a buzzword bolted onto an existing runbook.
Use AI to surface the likely runbook candidate from an alert’s context and pre-fill the diagnostic checklist before a human even opens a terminal. That’s genuinely useful: it narrows the search space in seconds instead of minutes. What AI should never do is execute a remediation step on its own. Practitioner experience across production teams consistently shows the same pattern: engineers lose real time to context gathering, pod names, log locations, which runbook applies, and automating that lookup helps enormously, but the actual fix still needs a human with authority to say yes.
If you’re building this out, start small. Some decision-tree prompts and Alertmanager templates are built around exactly this boundary: AI narrows the options, a person with IC authority pulls the trigger.
— James
Build Your Triage Workflow Faster With Devopsaitoolkit
Wiring runbooks into Alertmanager templates by hand takes real engineering time you’d rather spend on the actual incident backlog. Devopsaitoolkit gives you that wiring already built: prompt libraries for Alertmanager templating, a library of AI DevOps tools for incident response, and copy-paste runbook decision trees you adapt to your own services instead of drafting from a blank page.
If you’re running OpenStack alongside Kubernetes, the OpenStack prompt library covers troubleshooting and runbook selection for that stack specifically, since generic Kubernetes guidance rarely maps cleanly onto OpenStack failure modes. Everything is built for engineers who need working templates now, not another framework to learn before the next page comes in. Start by pulling the Alertmanager template pack and dropping it against your highest-volume alert this week, then expand from there as you see which runbooks actually get used.
Sources
- Google SRE Book — Managing incidents
- Incident response runbooks — playbooks and templates
- Set up Alertmanager 0.27 with Prometheus 2.50 for K8s (tutorial)
Recommended
- Building a Repeatable Linux Log Triage Workflow with an AI
- Best AI Tools for SRE Teams in 2026 (A Practitioner’s Guide)
- AI-Assisted Runbook Selection: Routing Alerts to the Right
- Drafting Runbooks From Resolved Incidents With AI
Get 500 Battle-Tested DevOps AI Prompts — Free
500 battle-tested, copy-paste AI prompts engineered by a senior systems engineer — every one with fill-in placeholders and safety/back-out notes. Drop your email and it's yours.
- 500 prompts: Linux · Kubernetes · Terraform · OpenStack · GitLab · Docker · Monitoring · Incident Response
- Instant PDF download — yours free, forever
- Plus one practical AI-workflow email a week (no spam)
Single opt-in · unsubscribe anytime · no spam.