GitLab Pipeline Debugging Step by Step for DevOps
Learn gitlab pipeline debugging step by step to quickly identify and fix CI/CD errors. Master essential tools and reduce downtime.
- #gitlab-cicd
- #debugging
- #ci-cd
- #pipelines
- #devops

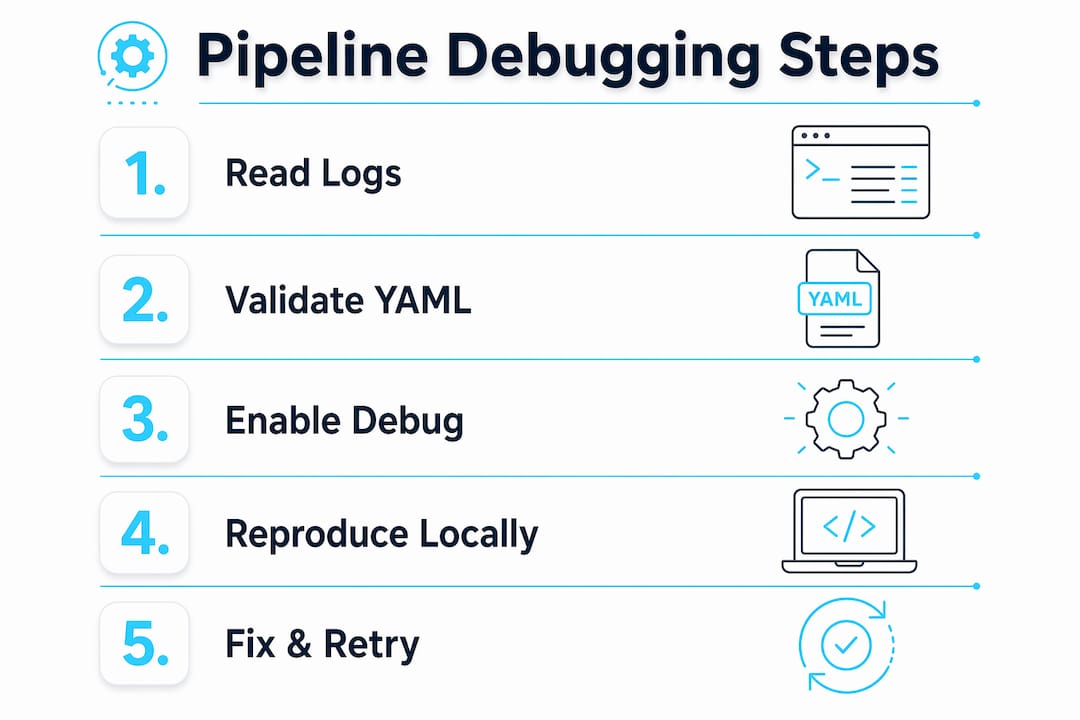
GitLab pipeline debugging step by step is the process of identifying, isolating, and fixing CI/CD errors through methodical investigation: log analysis, YAML validation, local job reproduction, debug tracing, and runner inspection. A five-step framework covering identify, isolate, consult, fix, and verify reduces debugging time from hours to minutes. The core tools are GitLab CI/CD’s built-in job logs, the CI Lint validator, the CI_DEBUG_TRACE variable, and the glab CLI. Master these four and you can resolve the majority of pipeline failures without guessing.
What are the prerequisites and tools needed for GitLab pipeline debugging?
Effective debugging starts before you open a single log file. You need Maintainer or Owner access to the GitLab project to view runner details, manage variables, and trigger manual jobs. Without that access level, you will hit walls fast.
The GitLab UI gives you three critical views: the pipeline graph, the job detail page, and the raw log output. Each view answers a different question. The pipeline graph shows you which stage failed. The job detail page shows you the runner, the image, and the exit code. The raw log gives you the full shell output.

For terminal-based workflows, the glab CLI is the tool I reach for first. Non-interactive commands like glab ci list and glab ci trace retrieve logs without menu navigation. That matters when you are debugging under pressure and need repeatable, scriptable inspection.
Before enabling advanced tracing, set up your local environment:
- Install
gitlab-runnerlocally for job reproduction - Pull the same Docker image your job uses (e.g.,
docker pull python:3.11-slim) - Export the same environment variables your pipeline sets
- Confirm Docker socket access if your jobs use Docker-in-Docker
Pro Tip: Never enable CI_DEBUG_TRACE on a shared or public repository. Sensitive variables like tokens and SSH keys print to the log in plain text. Use it only in private repos, and turn it off immediately after you capture what you need.
How do you systematically analyze logs and validate GitLab pipeline YAML?
The first rule of debugging GitLab CI is: read the full log before you change anything. Most engineers scroll to the red line and stop. The actual root cause is usually 10–20 lines above it, where a missing variable or a failed apt-get silently broke the environment.
Common pipeline failures include syntax errors, missing environment variables, runner mismatches, and artifact path problems. A checklist approach starting from logs and working outward to runner status isolates root causes faster than random fixes.
Reading job logs effectively
Focus your first pass on these signals in the raw log:
- Exit code:
exit code 1is a script failure;exit code 137is an out-of-memory kill - Last executed command: the line directly before the failure message
- Environment setup block: look for failed
before_scriptsteps that corrupt the job environment - Artifact upload/download errors: these appear at the end of the log after your script finishes
Validating your .gitlab-ci.yml
GitLab’s CI Lint tool validates your .gitlab-ci.yml syntax and logic before you push. Find it at CI/CD > Pipelines > CI Lint in your project. It catches indentation errors, undefined stages, and invalid needs references that would otherwise fail silently.
Common YAML pitfalls that cause silent failures: using tabs instead of spaces, referencing an undefined stage, and placing rules and only in the same job. The CI Lint tool catches the first two. The third one you have to spot manually.
Pro Tip: Use glab ci trace to stream a live log directly to your terminal. It is faster than refreshing the GitLab UI and works well inside tmux sessions during long builds.
How can you reproduce pipeline failures locally and use debug traces?
Reproducing a failure locally is the fastest way to cut the feedback loop. Instead of pushing a commit, waiting for a runner, and reading a log, you run the job on your machine in under a minute.
The process follows four steps:
- Pull the job image: run
docker pullusing the exact image tag from your.gitlab-ci.yml. Version drift betweenlatesttags is a common source of flaky failures. - Start a container: run
docker run --rm -it /bin/bashand paste your job script line by line. Watch where it breaks. - Inject variables: export your CI variables manually before running the script. Missing variables cause cryptic errors that look like permission failures.
- Run with
gitlab-runner exec: usegitlab-runner exec dockerfor a closer simulation of the actual CI environment, including artifacts and caching behavior.
For failures that only appear in CI, enable CI_DEBUG_TRACE. Set CI_DEBUG_TRACE: "true" in your job variables block. This prints every executed shell command and reveals hidden failures that standard logs suppress, such as a silently failing ssh-add or an environment variable that resolves to an empty string.
A practical example: an SSH agent setup failure often shows no error in the standard log because ssh-agent exits with code 0 even when the key is malformed. With CI_DEBUG_TRACE enabled, you see the exact ssh-add command and its output, which immediately reveals the key formatting issue.
Pro Tip: After capturing your debug trace output, set CI_DEBUG_TRACE: "false" and push immediately. Do not leave it enabled across multiple pipeline runs. Exposed secrets in logs are a real security risk, even in private repositories with broad team access.
What strategies help handle runner problems and flaky jobs?
Runner problems are the most misdiagnosed category of GitLab pipeline failures. Engineers assume the code is wrong when the runner is actually out of disk space, has a stale Docker layer cache, or lost network connectivity mid-job.
Runners need monitoring for resource exhaustion and proper privilege configuration, especially for Docker-in-Docker setups. Check these runner-side issues before touching your pipeline code:
- Disk space: a full
/var/lib/dockerdirectory causes image pull failures with misleading error messages - Docker socket: Docker-in-Docker jobs require
privileged: trueon the runner; missing this causesCannot connect to the Docker daemonerrors - Network connectivity: runner-to-registry timeouts produce
manifest unknownorconnection reseterrors that look like image problems - Stale cache: a poisoned cache volume causes jobs to fail with dependency errors that pass locally
Retries vs. root cause fixes
The retry trap is real. Blind retries hide issues like poisoned caches or expired secrets. A job that passes on the third retry is not fixed. It is a ticking clock.
Separating integration tests from unit tests is the single most effective structural fix for flaky pipelines. Unit tests run fast and deterministically. Integration tests depend on external services and network state. Mixing them in one job makes the entire job flaky, and retries just mask the real problem.
For artifact management during debugging, configure artifacts: when: always temporarily. This retains logs and output files even from failed jobs, giving you the evidence you need without re-running the pipeline.
Key takeaways
Systematic GitLab pipeline debugging requires log analysis, YAML validation, local reproduction, and runner inspection before applying any fix.
What I have learned from debugging pipelines the hard way
The most expensive debugging sessions I have had were not caused by complex code. They were caused by skipping the basics: not reading the full log, not validating the YAML first, and reaching for retries before understanding what was actually failing.
The glab CLI changed how I work. Running glab ci trace from a terminal means I can inspect a failing job in seconds without switching browser tabs. For inherited pipelines, the combination of glab ci list and a quick AI-assisted pipeline review cuts the time to understand an unfamiliar .gitlab-ci.yml from an afternoon to twenty minutes.
My honest advice on CI_DEBUG_TRACE: use it once, get what you need, and turn it off. I have seen teams leave it enabled for days across a shared project. The logs become a security audit finding, not a debugging tool.
Organizing job scripts with before_script for environment setup and script for the actual work is not just a style preference. It makes failures localize immediately. When before_script fails, you know the environment is broken. When script fails, you know the code is the problem. That separation saves real time.
For multi-project pipelines, keep documentation current. A pipeline that made sense six months ago becomes a mystery when the engineer who built it has moved on. Treat your .gitlab-ci.yml comments like runbook entries.
— James
How Devopsaitoolkit accelerates your GitLab debugging workflow
Debugging pipelines manually is slow. Devopsaitoolkit builds AI workflows for cloud engineers who manage GitLab, Kubernetes, Prometheus, and Linux infrastructure at scale. The prompt packs are built for real production scenarios, not toy examples.
The DevOps Security Prompt Pack covers secure variable handling, debug trace safety, and CI/CD hardening. The Linux Admin Prompt Pack includes runner troubleshooting, disk space diagnostics, and Docker socket configuration prompts. If you are spending more than 30 minutes on a pipeline failure, these prompts cut that time significantly.
FAQ
What is the first step in GitLab pipeline debugging?
Open the failed job’s raw log and read the full output, focusing on the last 20 lines and the before_script block. The exit code and the last executed command identify the failure category before you change anything.
How do I validate my .gitlab-ci.yml without pushing?
Use the GitLab CI Lint tool at CI/CD > Pipelines > CI Lint in your project, or run glab ci lint from your terminal. Both catch syntax errors and invalid stage references before they trigger a pipeline run.
When should I use CI_DEBUG_TRACE?
Enable CI_DEBUG_TRACE: "true" only when standard logs do not reveal the failure cause. It prints every shell command executed during the job, including environment variable values. Disable it immediately after use to prevent secret exposure.
How do I fix flaky GitLab CI jobs?
Separate unit tests from integration tests into distinct jobs and fix the root cause rather than adding retries. Retries mask systemic issues like poisoned caches or expired credentials, which will resurface under load.
How do I reproduce a GitLab CI failure locally?
Pull the exact Docker image your job uses, start a container, inject your CI variables manually, and run your job script line by line. For a closer simulation, use gitlab-runner exec docker to replicate caching and artifact behavior.
Recommended
- Debugging a Failing GitLab Pipeline: A Systematic Approach — DevOps AI ToolKit
- Using AI to Explain and Document an Inherited GitLab
- Optimizing GitLab Pipeline DAGs with needs: Using AI
- Mastering rules:changes in GitLab CI: Path-Scoped Pipelines
Download the Free 500-Prompt DevOps AI Toolkit
500 battle-tested, copy-paste AI prompts engineered by a senior systems engineer — every one with fill-in placeholders and safety/back-out notes. Drop your email and it's yours.
- 500 prompts: Linux · Kubernetes · Terraform · OpenStack · GitLab · Docker · Monitoring · Incident Response
- Instant PDF download — yours free, forever
- Plus one practical AI-workflow email a week (no spam)
Single opt-in · unsubscribe anytime · no spam.