
A Cloud Logging Strategy That Balances Security and Cost
Discover key best practices for an effective cloud logging strategy that enhances security while keeping costs manageable. Start optimizing today!

Prioritize control-plane and audit logs first, structure every event with a stable schema, and enforce sampling and drop rules before storage costs spiral. That’s the whole game: centralize what matters, cut what doesn’t, and lock down access to what remains. If you do nothing else this week, do these three things.
- Enable org-level audit trails now. Turn on management/admin activity logging across every account and project, not just the ones you remember to check.
- Stand up a central log sink. Route logs into one observability project or bucket structure instead of letting each team scatter them across accounts.
- Apply drop rules for noise. Health checks and load balancer pings should never touch your paid ingestion pipeline.
Everything below explains why this order works and how to build it out without drowning your team in log volume or your budget in ingestion fees.
Key Takeaways
Effective cloud logging strategy requires prioritizing control-plane and audit logs, enforcing a stable structured schema, applying sampling and drop rules for cost control, and locking down access with least-privilege IAM and tamper detection.
| Point | Details |
|---|---|
| Prioritize audit logs first | Enable org-level audit trails before investing heavily in application debug logging. |
| Standardize your schema | Use OpenTelemetry or ECS field conventions and version them like code. |
| Control cost at ingestion | Apply drop rules and tail sampling before logs reach paid storage tiers. |
| Lock down access | Use least-privilege IAM and immutable storage for audit trails specifically. |
| Test logging in CI | Run schema validation and volume regression tests to catch drift early. |
Table of Contents
- Core Principles Behind Any Cloud Logging Strategy
- Prioritize Control-Plane and Audit Logs First
- Designing Structured Logs With a Stable Schema
- Reliable Log Collection Across Apps, Containers, and VMs
- Routing and Aggregating Logs Into One Observability Hub
- Storage, Retention, and Cost Control
- Access Control and Log Integrity
- Sampling and Drop Rules for High-Throughput Services
- Turning Logs Into Alerts That Don’t Cause Fatigue
- Governance: Policy as Code for Logging
- A Runbook for Implementing or Auditing Your Logging Setup
- How DevOps AI ToolKit Speeds Up Adoption
- Put This Logging Strategy Into Practice
- Editorial Take: What the Conventional Advice on Logging Gets Wrong
- Sources
Core Principles Behind Any Cloud Logging Strategy
Every logging decision should trace back to one of four goals: security forensics, debugging, compliance, or performance analysis. If a log line doesn’t serve one of those, it’s probably just cost with no upside.
- Prioritize signal over volume. Logging everything sounds thorough, but it buries the events that actually matter under noise nobody reads.
- Match log type to purpose. Forensic investigations need different retention and detail than a debugging session that ends in an hour.
- Treat logs as data, and logging infrastructure as code. Schemas, retention rules, and sampling logic belong in version control, not in someone’s memory.
- Design for the audit you’ll need in a year, not just the incident you’re chasing today. A schema that changes every sprint won’t hold up when a compliance team asks for six months of history.
The tradeoff is real: broad, verbose logging feels safer until the bill arrives or the SIEM chokes on volume it can’t parse fast enough.
Prioritize Control-Plane and Audit Logs First
Control-plane and audit logs give you the widest security coverage per byte logged, because they capture who created, modified, or accessed a resource, which maps directly to the early stages of most attacks. Application debug logs tell you what broke. Audit logs tell you who touched what, and that’s the data forensics teams actually need.
Start with these categories before anything else:
- Admin activity logs covering resource creation, deletion, and permission changes.
- Organization-level audit trails so new accounts or projects inherit logging automatically instead of creating blind spots.
- Data-access logs for any system touching regulated or sensitive data, even if the volume is painful.
Control-plane logs consistently provide better kill-chain coverage than scattered application logs, because they capture the discovery and initial-access phases attackers rely on. Map each log category to a specific business asset or threat model. A logging plan without that mapping tends to log what’s easy to log rather than what’s actually at risk. Our own breakdown of audit logging and threat detection walks through building a trail you can genuinely investigate, not just one that looks complete.
Designing Structured Logs With a Stable Schema
A log line without a consistent shape is barely searchable. Every event should carry the same core fields regardless of which service emitted it: timestamp, trace ID, severity, service name, environment, and a human-readable message.
- Use consistent field names across every service;
user_idin one place anduserIdin another breaks correlation. - Include trace and span IDs so a single request can be followed across a dozen microservices without guesswork.
- Keep field types stable. A field that’s sometimes a string and sometimes an integer will quietly break every query built against it.
- Version your schema and document changes in a changelog teams can actually find.
Adopting OpenTelemetry or Elastic Common Schema (ECS) conventions instead of inventing your own field names pays off the first time you onboard a new service or swap log backends. The OWASP Logging Cheat Sheet is blunt about this: standardized formats that capture “when, where, who, and what” for every event, reviewed in code review and tested like any other contract, prevent the kind of schema drift that turns a query into a guessing game six months later.
Pro Tip: Run a schema diff check in CI whenever a service changes its log output. Catching a renamed field before it ships saves you a painful debugging session during the next incident, not after.
Reliable Log Collection Across Apps, Containers, and VMs
Collection strategy depends on workload shape. A long-running VM can run a local agent comfortably. A container that lives for ninety seconds cannot.
- Use client libraries when you need rich, structured events tied directly to application context.
- Use agents (Fluentd, Fluent Bit) for VM and host-level collection where you want minimal application overhead.
- Use sidecars in Kubernetes when you need per-pod isolation without modifying application code.
The OpenTelemetry Collector has become the default hub for enrichment, sampling, and forwarding, since it lets you centralize sampling decisions instead of configuring them separately in every service. For autoscaling or ephemeral workloads, buffer locally with bounded queues and flush asynchronously so a scale-down event doesn’t silently drop logs mid-flush.
Routing and Aggregating Logs Into One Observability Hub
Scattered logs across dozens of accounts create blind spots and duplicate work. The fix is aggregation at the folder or organization level, feeding into a single observability project rather than per-team silos.
- Set up aggregated sinks at the org level so new projects inherit routing automatically instead of requiring manual setup.
- Separate buckets by environment, team, or log type; a production security bucket shouldn’t share retention rules with a dev debug bucket.
- Route sensitive application data to segregated storage when compliance requires it, following the separation patterns Google Cloud documents for hybrid and multi-cloud environments.
- Export to a SIEM for real-time security correlation, to a data warehouse like BigQuery for analytics, or to cold archive storage for logs you’re required to keep but rarely query.
Centralizing log management through aggregated sinks genuinely simplifies both compliance reporting and day-to-day operations, since teams stop hunting across accounts for the log they need.
Storage, Retention, and Cost Control
Retention should follow purpose, not habit. Forensic and compliance logs often need months of retention; debug logs from a staging environment rarely need more than a couple of weeks.
- Group logs by retention need and pick storage regions and bucket structures that satisfy compliance without paying premium rates for data nobody queries after week two.
- Apply drop rules at ingestion to strip known-noisy lines, health checks, synthetic monitoring pings, and repetitive warnings before they hit paid storage.
- Use tail sampling for high-value transactions and head sampling for high-volume, low-stakes traffic.
- Move older logs to tiered cold storage automatically instead of leaving everything in hot storage indefinitely.
- Set ingestion-volume alerts so a misconfigured service logging in a tight loop doesn’t blow through your monthly budget overnight.
Statistic Callout: Structured wide events combined with tail sampling and ingestion-time drop rules let teams cut storage costs meaningfully while preserving the detail needed for debugging and forensics, according to PostHog’s engineering guidance on logging at scale.
Google Cloud’s own documentation recommends designing storage and retention around purpose from the start, since retrofitting retention policy onto an existing pile of unsorted logs is far more expensive than doing it up front.
Access Control and Log Integrity
Logs are a security asset until they become a security liability, usually the moment someone realizes they contain PII or that an attacker can quietly delete the evidence of their own intrusion.
- Apply least-privilege IAM roles at the log-view level, not just at the project level; not every engineer needs read access to production audit trails.
- Mask, hash, or exclude personally identifiable information by default. If you must retain it, document the legal basis and retention period explicitly.
- Implement write-once storage (WORM) or tamper-evident configurations for audit logs specifically, since those are the records an incident response team relies on most.
- Encrypt logs in transit and at rest, and keep an audit trail of who accessed the audit trail itself.
The OWASP guidance on avoiding PII in logs is worth reading closely here, particularly around masking strategies that preserve debuggability without exposing sensitive fields. Our piece on finding public cloud exposure with IAM and S3 misconfigurations covers how loose access controls on storage buckets extend directly to log data too.
Sampling and Drop Rules for High-Throughput Services
At any real scale, logging every request is neither affordable nor useful. The choice between head sampling and tail sampling comes down to whether you can afford to decide before or after you know how a request turned out.
- Head sampling decides upfront (log 1 in 100 requests) and is simple to implement but risks missing rare failures.
- Tail sampling waits until a trace completes, then keeps the interesting ones (errors, high latency) and discards the routine. It’s more accurate but requires buffering and a centralized sampling decision, commonly handled through the OpenTelemetry Collector.
- Apply drop rules at the edge for known-noisy endpoints, health checks and load balancer pings above all.
- Use async logging with bounded buffers so a logging backpressure event doesn’t cascade into an application outage.
Pro Tip: If your logging pipeline can take down your application during a traffic spike, your sampling strategy is backwards. Logging should degrade gracefully, never take priority over serving traffic.
Turning Logs Into Alerts That Don’t Cause Fatigue
A log-based metric is only useful if it drives a decision. Build metrics around rare, critical events and meaningful trends, not every four-hundred error your API throws in a normal day.
- Design log-based metrics for events that are rare and high-signal (auth failures spiking, a permission change on a production resource) rather than counting every warning line.
- Set thresholds against aggregated trends, not single occurrences, to avoid paging someone at 3 a.m. over a blip that resolved itself.
- Link every alert to a runbook and, where possible, a trace ID so the on-call engineer starts triage with context instead of a blank terminal.
Alert fatigue kills incident response faster than missing data does. An engineer who’s been paged for the same noisy, low-value alert a dozen times will eventually silence it, and that’s the alert that matters on the thirteenth occurrence.
Governance: Policy as Code for Logging
Logging infrastructure drifts the same way any other infrastructure does, quietly, unless it’s treated with the same rigor as application code.
- Store logging schema, retention rules, and alert thresholds in version control, reviewed the same way you’d review a pull request touching production infrastructure.
- Run logging-specific tests in CI: schema validation, injection tests for malicious log input, and volume regression tests that catch a service suddenly logging ten times its normal rate.
- Assign clear ownership for log data, including operational SLAs for who responds when a sink stops receiving data.
Version-controlling logging schema and exercising it in CI prevents the kind of silent schema drift that breaks dashboards months after the change that caused it. Treating the logging pipeline as part of the software lifecycle, reviewed in pull requests rather than configured once and forgotten, is the difference between a logging strategy and a logging accident waiting to happen.
A Runbook for Implementing or Auditing Your Logging Setup
- Enable organization-level audit trails across every account, including newly created ones.
- Stand up a central observability project with aggregated sinks routing from every environment.
- Standardize your schema using OpenTelemetry or ECS field conventions, with versioning in place.
- Configure sampling and drop rules for known-noisy traffic before enabling full collection.
- Set retention tiers by purpose, moving cold data out of expensive hot storage automatically.
- Apply least-privilege IAM at the log-view level and enable immutability for audit logs.
- Build log-based metrics for critical, rare events and tie alerts to runbooks.
Post-rollout, watch ingestion volume, cost per gigabyte, and alert-to-noise ratio for the first few weeks. Those three numbers tell you fast whether the strategy is working or just shifting the mess somewhere else.
How DevOps AI ToolKit Speeds Up Adoption
Building this from scratch takes weeks. The Audit & Logging Policy Design Prompt gives you a working template for policy, schema, and retention decisions instead of a blank document. Pair it with the kube-apiserver audit policy guide for control-plane specifics, and you can generate a first-draft schema and matching CI tests in an afternoon rather than a sprint. James’s practitioner write-ups across the site focus on what actually breaks in production logging setups, not theoretical best practice, which is the gap most generic guides leave open.
Put This Logging Strategy Into Practice
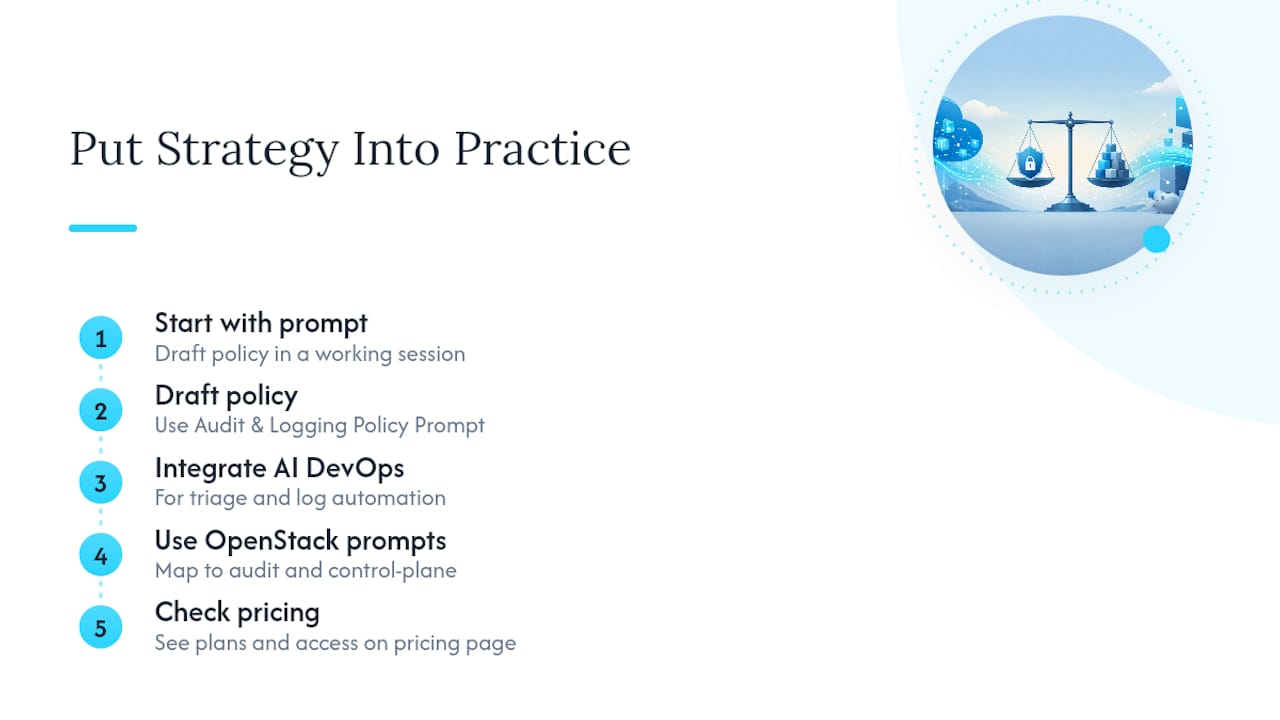
A cloud logging strategy only earns its keep once it’s actually running against real traffic, not sitting in a design document. If you’re evaluating your current setup against everything above, start with the Audit & Logging Policy Design Prompt to draft your policy in a working session instead of a series of meetings. Pair it with the broader AI DevOps tools for incident response and log automation to see how triage and validation fit around your logging pipeline once the data starts flowing. If OpenStack is part of your stack, the OpenStack AI prompt library has ready-made prompts that map directly onto the audit and control-plane priorities covered here. Full details on plans and access are on the pricing page.
Editorial Take: What the Conventional Advice on Logging Gets Wrong
Most logging advice treats “log everything” as a safety net. It’s the opposite. Every unnecessary log line is a cost you pay forever and a needle you’ll have to find in a bigger haystack the day something actually breaks. The teams that handle incidents well aren’t the ones with the most logs; they’re the ones whose audit trail is complete and whose noise is aggressively filtered out before it ever reaches storage.
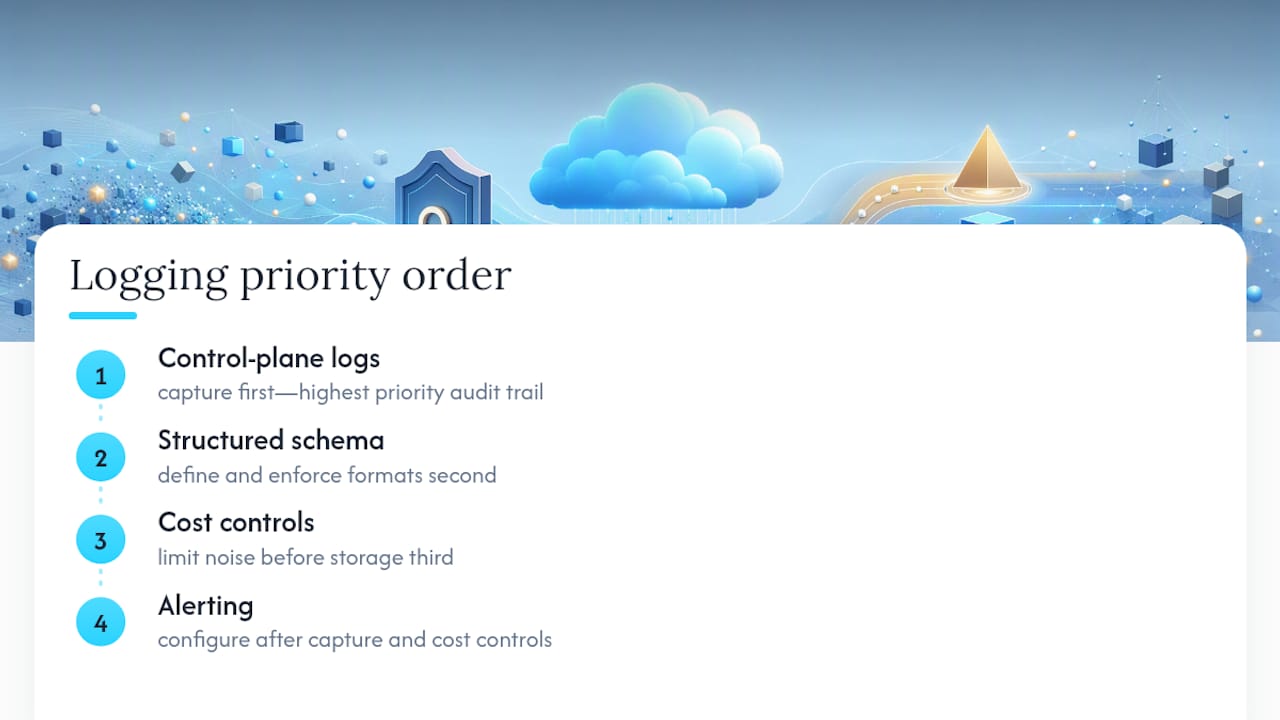
The conventional wisdom also underrates governance. Engineers love designing the schema once and moving on, but a logging pipeline without CI tests and version control degrades exactly like any other untested system, quietly, until an incident reveals the gap. Priority order matters more than most guides admit: control-plane logs first, structured schema second, cost controls third, alerting last. Skip that order and you end up with a beautifully sampled pipeline that never captured the one admin action that mattered.
If you take one thing from this, prioritize ruthlessly. Get the audit trail right before you obsess over dashboards. Everything else is refinement.
— James
Sources
Recommended
- Pricing — DevOps AI ToolKit
- Audit Logging and Threat Detection: Building a Trail You Can Actually Investigate — DevOps AI ToolKit
- Cloud Egress Costs Explained for Engineers: Cut Bills Fast
Get 500 Battle-Tested DevOps AI Prompts — Free
500 battle-tested, copy-paste AI prompts engineered by a senior systems engineer — every one with fill-in placeholders and safety/back-out notes. Drop your email and it's yours.
- 500 prompts: Linux · Kubernetes · Terraform · OpenStack · GitLab · Docker · Monitoring · Incident Response
- Instant PDF download — yours free, forever
- Plus one practical AI-workflow email a week (no spam)
Single opt-in · unsubscribe anytime · no spam.