
AI Workflows Cloud Cost Optimization: 2026 Playbook
Discover effective strategies for AI workflows cloud cost optimization. Implement token budgets and telemetry to avoid surprise billing now!

Enforce token budgets at the API gateway, add token-level telemetry to Prometheus, and set circuit breakers on every autonomous agent — those three moves stop the majority of surprise AI bills before they hit your invoice. Cloud billing alone cannot attribute costs to teams, applications, or individual developers; you need token-level attribution running alongside GPU and CPU metrics. Here is your immediate checklist:
- Instrument every inference call with
tokens_in,tokens_out, andmodel_versionlabels in Prometheus. - Set a hard per-team token budget at the gateway (reject, don’t just warn).
- Add loop detection to any autonomous agent that can call a model recursively.
- Tag all GPU workloads in Kubernetes with cost-center labels before the next billing cycle.
- Run Infracost in your Terraform pipeline to catch GPU instance changes before they merge.
Pro Tip: Place hard-block limits at the gateway for production traffic and warn-only limits in staging. Surface both token spend and GPU utilization in the same Grafana dashboard so engineers see cost impact without switching tools.
Table of Contents
- How do you build an AI workflow cost optimization loop?
- What token metrics do you actually need in Prometheus?
- How do you enforce hard token budgets without breaking production?
- Where should you run models to control inference costs?
- How do you make cost controls part of daily engineering work?
- Which engineering levers cut AI spend the most?
- Three production recipes you can drop in today
- Key Takeaways
- What production AI cost control actually taught me
- Devopsaitoolkit gives you the playbooks, not just the theory
- Primary sources and further reading
How do you build an AI workflow cost optimization loop?
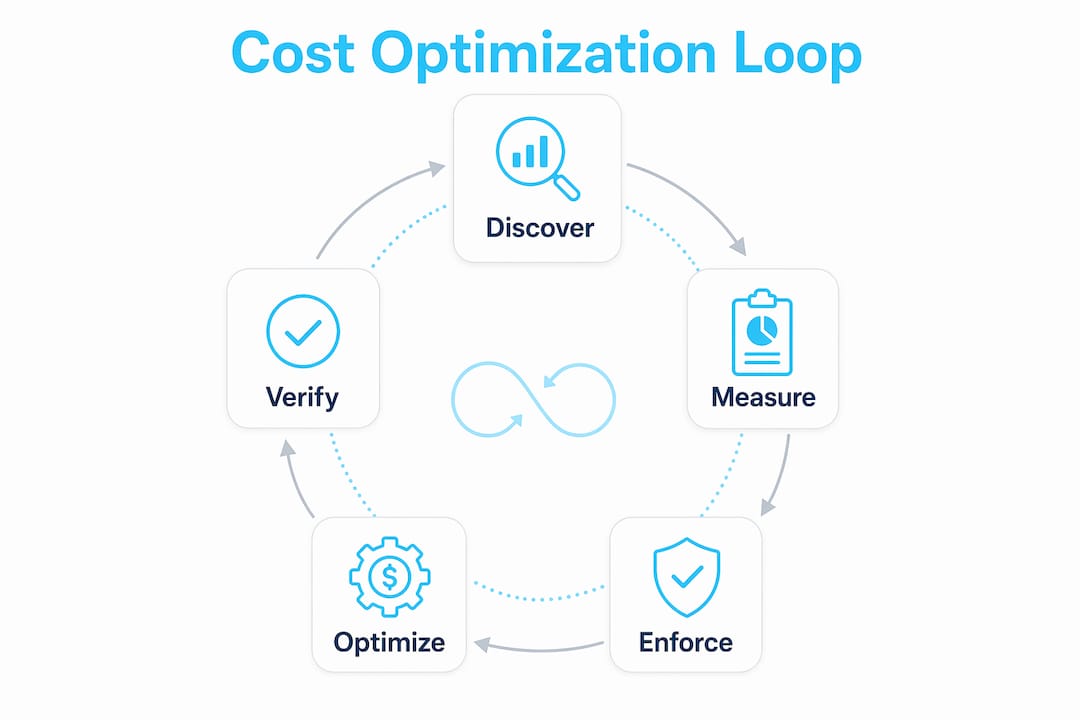
The most effective pattern is a five-step loop: discover, measure, enforce, optimize, verify. Gartner data cited by Camunda suggests up to a 70% reduction in modernization costs by 2027 through AI applied to process orchestration — but only teams with governance in place capture that upside.
| Step | Action | Time to Value |
|---|---|---|
| Discover | Audit all inference calls; map models, token volumes, and GPU hours | Hours (1 day) |
| Measure | Add Prometheus token exporters; build Grafana cost dashboard | 1–3 days |
| Enforce | Deploy gateway token budgets and circuit breakers per team | 3–5 days |
| Optimize | Apply model routing, caching, batching, and prompt compression | 1–3 weeks |
| Verify | Compare before/after metrics; report savings to finance | Ongoing |
Integrate the enforce step into your GitLab or GitHub Actions pipeline so budget checks run on every merge request. Use Terraform with Infracost to flag GPU instance cost changes in pull requests before they reach production. Team-level budgets map cleanly to GitLab groups or Kubernetes namespaces, which makes chargeback reporting straightforward.
What token metrics do you actually need in Prometheus?
Token-level telemetry is the only way to attribute AI cost accurately. Cloud bills show you GPU hours; they don’t show you which prompt, session, or developer burned them.
Record these metrics at every inference call:
ai_tokens_input_total{model, team, app}— input tokens per requestai_tokens_output_total{model, team, app}— output tokens per requestai_prompt_cache_hit_rate{model}— fraction of input tokens served from cacheai_inference_duration_ms{model, tier}— end-to-end latencyai_gpu_utilization_ratio{node, pool}— GPU utilization alongside token signalsai_reasoning_tokens_total{model}— reasoning tokens for chain-of-thought models (OpenAI o-series, Anthropic Claude extended thinking)
Name metrics with the ai_ prefix and include model_version as a label so you can compare costs across OpenAI GPT-4o, Claude 3.5 Sonnet, and smaller open-source models on the same dashboard.
Pro Tip: Wire token metrics into your IDE via an MCP server or a VS Code extension so engineers see per-request cost as they write prompts — not after the sprint ends.
Tie CI checks to these metrics: a GitLab pipeline job that queries Prometheus and fails if a new prompt template exceeds a token-per-request threshold catches regressions before they ship. For GitLab pipeline telemetry, OpenTelemetry traces give you the full call graph alongside token counts.
| Metric | Why It Matters |
|---|---|
ai_tokens_input_total | Largest cost driver for most chat/completion workloads |
ai_prompt_cache_hit_rate | Cache hits cut input token costs substantially on supported APIs |
ai_reasoning_tokens_total | Reasoning models bill these separately; they spike fast |
ai_gpu_utilization_ratio | Idle GPUs at 20% utilization still bill at full rate |
How do you enforce hard token budgets without breaking production?
Enforce hard per-team token budgets at the gateway before costs reach billing. The pattern is a two-stage circuit breaker: soft warn at 80% of budget, hard block at 100%. Gateway enforcement adds roughly 3–4ms of latency — negligible against model inference times that run 200ms–10s.
| Budget State | Action | Use Case |
|---|---|---|
| Under 80% | Pass through | Normal operation |
| 80%–100% | Warn + log | Alert team lead; degrade gracefully |
| Over 100% | Hard block or route to cheaper model | Prevent invoice overrun |
| Agent loop detected | Kill request; return error | Stop recursive agent spirals |
Runaway autonomous agents can generate thousands of model calls for a single user request. Add loop detection by tracking (session_id, prompt_hash) pairs; if the same hash appears more than N times in a rolling window, terminate the chain and return a structured error.
Fallback decision matrix — choose by workload priority:
| Situation | Policy | Rationale |
|---|---|---|
| Latency-sensitive, high value | Degrade to smaller model | Preserve UX; cut cost 60–80% |
| Batch, non-urgent | Queue for off-peak window | Use spot/preemptible GPUs |
| Dev/staging environment | Hard reject at sandbox budget | Prevent dev waste from hitting prod billing |
| Unknown or new workload | Warn-only for 48 hours, then enforce | Gather baseline before blocking |
Where should you run models to control inference costs?
Model placement materially changes unit economics. GPUs cost 10–20x more than standard CPU compute on cloud providers, so the placement decision is one of the highest-leverage cost levers you have.

| Deployment Pattern | Cost Profile | Best For |
|---|---|---|
| Managed inference (AWS Bedrock, GCP Vertex, Azure AI) | Pay-per-token; no idle cost | Spiky, unpredictable workloads |
| Kubernetes GPU node pool (A10G, L4) | Fixed hourly; amortized over volume | Steady, high-volume inference |
| OpenStack GPU nodes (on-prem/hybrid) | CapEx; lowest per-token at scale | Regulated data; predictable load |
| CPU-only (small models, embeddings) | Cheapest; 10–20x less than GPU | Embeddings, classification, reranking |
Pro Tip: Run embeddings and reranking on CPU node pools in Kubernetes. Reserve GPU node pools for generative inference only. Use Kubernetes node affinity and nvidia.com/gpu resource requests to enforce this split automatically.
For Kubernetes, configure the Horizontal Pod Autoscaler against a custom Prometheus metric (ai_tokens_per_second) rather than CPU utilization — CPU is a lagging indicator for inference workloads. On OpenStack, use OpenStack AI prompts to generate Heat templates that schedule GPU instances only during peak windows and terminate them on idle.
- Create a dedicated GPU node pool with taints (
gpu=true:NoSchedule). - Set resource requests to
nvidia.com/gpu: 1on inference pods only. - Configure Cluster Autoscaler with a scale-down delay of 10 minutes to avoid thrashing.
- Use spot instances for batch training; on-demand for latency-sensitive inference.
- Right-size: an A10G handles most 7B–13B model inference; an A100 is rarely needed outside 70B+ models.
How do you make cost controls part of daily engineering work?
Operationalized governance — budgets plus CI checks plus audit trails — is what turns cost policy into practice. Policy documents nobody reads don’t change behavior; a failing pipeline job does.
- Staging gate: Run every new prompt template through a token-count check in CI before merging.
- Canary model changes: Roll model version changes to 5% of traffic; compare
ai_tokens_output_totaland latency before promoting. - GitLab budget check job: Query Prometheus in a scheduled pipeline; post a Slack alert if any team exceeds 90% of monthly token budget.
- Audit log: Write every inference call’s
(team, app, model, tokens_in, tokens_out, cost_usd)to an append-only log (S3, GCS, or OpenStack Swift). - Monthly review: Finance sees chargeback by team; platform team reviews top-10 cost drivers; app teams own their own budgets.
Pro Tip: Give each application team a sandbox budget in staging that resets weekly. Engineers who burn through it early learn token discipline faster than any training session.
Stakeholder ownership matrix:
| Role | Owns | Reviews |
|---|---|---|
| Finance | Monthly chargeback report | Quarterly budget vs. actual |
| Platform team | Gateway config, Prometheus rules, audit log | Weekly cost anomalies |
| Application team | Per-app token budgets, prompt templates | Daily dashboard |
Which engineering levers cut AI spend the most?
A small set of levers yields the largest wins when measured systematically. Vendor case studies report notable token reductions from prompt-aware tooling and substantial savings through model migration and right-sizing in select cases.
| Lever | Typical Impact | Effort |
|---|---|---|
| Route to smaller model (e.g., GPT-4o mini vs. GPT-4o) | 60–80% cost reduction | Low |
| Semantic/prompt caching | Fewer API calls | Medium |
| Inference batching | 20–40% GPU utilization improvement | Medium |
Response truncation (max_tokens) | Output token reduction | Low |
| Prompt compression (remove redundant context) | 10–20% input token reduction | Low |
| Quantization for self-hosted models | Memory reduction; lower GPU cost | High |
Start with model routing and caching — they require no model changes and show results within days. Design each change as a small experiment: hold one variable, measure ai_tokens_total and quality score (BLEU, human eval, or task success rate) before and after, and set a rollback threshold.
Pro Tip: Never truncate responses without testing quality. Set max_tokens 20% below your observed p95 output length and run a quality regression suite before promoting to production.
- Baseline: record current
tokens/request,cost/request, and quality score. - Apply one lever at a time.
- Run for 48–72 hours at 10% traffic.
- Compare metrics; roll back if quality score drops more than 5%.
- Promote and document the saving in your cost dashboard.
Three production recipes you can drop in today
Enterprises using AI gateways report substantial reductions in inference costs. Here are three recipes to get there.
Recipe 1 — Gateway token budget policy (YAML pseudocode):
policies:
  - name: team-budget-enforcer
    match: {header: "X-Team-ID"}
    token_budget:
      limit: 500000        # tokens/day
      warn_at: 0.8
      action_at_limit: block_or_route_fallback
      fallback_model: gpt-4o-mini
    loop_detection:
      window_seconds: 60
      max_identical_prompts: 3
Recipe 2 — Prometheus token exporter (Go pseudocode):
tokenCounter := prometheus.NewCounterVec(
    prometheus.CounterOpts{Name: "ai_tokens_input_total"},
    []string{"model", "team", "app"},
)
// After each inference call:
tokenCounter.With(labels).Add(float64(resp.Usage.PromptTokens))
Recipe 3 — GitLab CI token budget check:
check-token-budget:
  script:
    - |
      USAGE=$(curl -s "$PROMETHEUS_URL/api/v1/query" \
        --data-urlencode 'query=sum(ai_tokens_input_total{team="$CI_PROJECT_NAMESPACE"})' \
        | jq '.data.result[0].value[1]')
[ "$USAGE" -lt "$TOKEN_BUDGET_LIMIT" ] || (echo "Token budget exceeded"; exit 1)- Deploy the gateway policy as a Kubernetes sidecar or Envoy filter alongside your inference service.
- Mount the Prometheus exporter as a sidecar container in the inference pod spec.
- Add the CI check as a scheduled GitLab pipeline job that runs nightly.
- For OpenStack deployments, expose the exporter via a Heat-managed service endpoint.
Pro Tip: Use Prometheus monitoring prompts to generate alert rules for token budget breaches — a pre-built PromQL alert fires faster than writing one from scratch under pressure.
| Recipe | Integration Point | Testing Checklist |
|---|---|---|
| Gateway policy | Envoy/Kong/custom middleware | Verify block fires at limit; test fallback model routing |
| Prometheus exporter | Pod sidecar or library | Confirm labels match; check cardinality |
| GitLab CI check | Scheduled + MR pipeline | Test pass/fail with mock Prometheus data |
Key Takeaways
Enforce token budgets at the gateway, instrument Prometheus with token-level metrics, and apply model routing first — those three moves deliver the fastest, most measurable cost reductions in production AI workflows.
| Point | Details |
|---|---|
| Token telemetry is non-optional | Cloud bills alone cannot attribute AI costs; add Prometheus token metrics to every inference call. |
| Gateway enforcement stops overruns | Hard-block limits at the gateway prevent runaway agent loops before costs hit invoices. |
| Model routing cuts costs fastest | Routing to a smaller model (e.g., GPT-4o mini) typically reduces cost 60–80% with low effort. |
| Governance needs CI integration | Budget checks in GitLab pipelines change engineer behavior faster than policy documents alone. |
| Devopsaitoolkit accelerates delivery | Ready-made playbooks, Prometheus prompt packs, and OpenStack prompt libraries cut implementation time from weeks to days. |
What production AI cost control actually taught me
The part that surprises most teams isn’t the technology — it’s the behavior change. You can deploy a perfect gateway with hard token limits, and engineers will route around it by spinning up a personal API key. The controls only stick when cost visibility lives where engineers already work: in the IDE, in the CI pipeline, in the same Grafana dashboard they check for latency.
The second surprise is agent loops. I’ve seen a single misconfigured ReAct agent generate over 2,000 model calls in under three minutes because nobody set a recursion limit. The bill was real; the output was garbage. Loop detection feels like an edge case until it happens to you, and then it becomes the first thing you configure.
The third lesson: start with model routing, not quantization. Quantization is powerful but operationally expensive — you need to validate quality, manage model versions, and handle hardware compatibility. Routing a low-complexity request to GPT-4o mini instead of GPT-4o takes an afternoon and shows up in the next billing cycle. Measure that win first, then invest in the harder levers.
For AI-driven cost reduction to stick long-term, finance and platform teams need a shared dashboard. When finance can see token spend by team without asking engineering for a report, the conversation shifts from “why is the bill high?” to “which team needs help optimizing?”
Devopsaitoolkit gives you the playbooks, not just the theory
Skip the weeks of trial and error. Devopsaitoolkit packages the five-step workflow above into ready-made prompt libraries, Prometheus alert rules, and CI check templates built specifically for Kubernetes, OpenStack, and GitLab environments.
The toolkit includes Prometheus monitoring prompt packs with pre-built PromQL for token budget alerts, OpenStack Heat template prompts for GPU scheduling, and GitLab CI snippet libraries for cost gate jobs. If you want a faster path, the infrastructure audit service maps your current AI spend to the levers in this guide and delivers a prioritized fix list within a week. Engineers on production stacks don’t have time to build every control from scratch. Grab the toolkit and drop the recipes directly into your pipelines.
Primary sources and further reading
- TokenOps / FinOps for tokens (OpsLyft) — The clearest practitioner explanation of token-level attribution and why traditional FinOps tooling misses AI spend. Used throughout the instrumentation and cost-levers sections.
- AI cost optimization strategies (TrueFoundry) — Gateway-enforced budget patterns and circuit-breaker design. Supports the circuit-breaker and implementation-recipe sections. Vendor-produced but technically detailed.
- AI cost optimization practical guide (TrueFoundry) — Gateway latency overhead data (3–4ms) and inference cost reduction case studies (40–60%). Used in the circuit-breaker and recipes sections.
- AI workload cost optimization (LogicMonitor) — GPU cost multiplier data (10–20x vs. CPU) and rightsizing guidance. Supports the architecture-patterns section. Practitioner-oriented.
- AI cost optimization visibility (PointFive) — Token attribution gap and prompt-aware tooling impact ranges (10–20% token reduction; up to ~80% via model migration). Used in instrumentation and cost-levers sections.
- Reasoning budget for AI agents (Medium/Diptendud) — Practical pseudocode and framing for inference budgets on autonomous agents. Supports the circuit-breaker and loop-detection sections. Independent practitioner post.
- AI process automation and Gartner 70% claim (Camunda) — Source for the 70% modernization cost reduction projection by 2027. Used in the recommended-workflow section. Vendor-produced; treat as directional evidence.
- Cloud cost management overview (IBM) — Background on how classic FinOps differs from AI-specific cost governance. Supports the governance section. High-authority general reference.
Recommended
- AWS Cost Optimization With AI: Rightsizing and Savings Plans
- Azure Cost Management With AI: Rightsizing, Reservations
- AI Workflows for Real Cloud Engineers — DevOps AI ToolKit
- How DevOps Teams Use AI to Reduce Cloud Costs (FinOps)
Get 500 Battle-Tested DevOps AI Prompts — Free
500 battle-tested, copy-paste AI prompts engineered by a senior systems engineer — every one with fill-in placeholders and safety/back-out notes. Drop your email and it's yours.
- 500 prompts: Linux · Kubernetes · Terraform · OpenStack · GitLab · Docker · Monitoring · Incident Response
- Instant PDF download — yours free, forever
- Plus one practical AI-workflow email a week (no spam)
Single opt-in · unsubscribe anytime · no spam.