
Best AI Tools for Kubernetes Log Analysis in 2026
Discover the best AI tools for Kubernetes log analysis in 2026. Find customizable solutions and fast root-cause analysis for your needs.

For fast, explainable root-cause analysis in Kubernetes, your best starting point is an LLM-backed RCA agent paired with a structured log pipeline and local embeddings. If you want a customizable, prompt-driven workflow you can tune to your own cluster, start with Devopsaitoolkit. For a managed platform with embedded AI investigation, Logz.io is the strongest out-of-the-box pick. For open-source RCA wired to Alertmanager, KubeRCA gets you there without a SaaS contract.
TL;DR by use-case:
- Fastest RCA: Logz.io (embedded AI agent, confidence scores, evidence mapping) or Devopsaitoolkit (customizable prompt workflows)
- Anomaly detection at scale: Elasticsearch with Streams + AI assistant, or Metoro for multi-cluster correlation
- Security-focused teams: Falco / Falco Vanguard for runtime detection, Aikido Security for triage workflows
- Best self-hosted option: SigNoz (full telemetry stack) or K8sGPT (conversational diagnostics, runs in-cluster)
- Immediate wins: structured log ingest cuts MTTR, hypothesis-driven diagnosis beats grep, and self-hosted embeddings keep sensitive data inside your VPC
Table of Contents
- Which AI tools are best for Kubernetes log analysis right now?
- Side-by-side comparison of AI Kubernetes logging tools
- How does AI-powered Kubernetes log analysis actually work?
- How to integrate AI tools into your Kubernetes logging pipeline
- How do you choose the right AI log-analysis tool for your team?
- What does the evidence say about AI for Kubernetes log analysis?
- Key Takeaways
- An experienced operator’s take on AI in Kubernetes incident workflows
- Devopsaitoolkit gives you a faster path to a production-ready AI log workflow
- Useful sources and vendor docs to read next
Which AI tools are best for Kubernetes log analysis right now?
The table and shortlist below map each tool to the Kubernetes use-case it actually solves. Not every team needs the same thing: an SRE chasing a CrashLoopBackOff at 2 AM needs different tooling than a security engineer triaging a runtime anomaly.
Devopsaitoolkit
Devopsaitoolkit is the right starting point for teams that want to build their own AI-assisted log-analysis workflow rather than buy a black box. It provides prompt libraries, AI workflow templates, and quickstart guides specifically for cloud engineers working with Kubernetes, Prometheus, and production infrastructure. The AI workflows for Kubernetes troubleshooting are pre-structured for incident triage, so you are not writing prompts from scratch at 3 AM.
Best for: Teams that want customizable, auditable AI workflows and a vendor-aligned POC starting point.
K8sGPT
K8sGPT runs inside your cluster and lets operators ask natural-language questions about cluster state. It surfaces diagnostics for failing pods, misconfigured resources, and event anomalies without requiring a separate observability platform. It is the fastest way to get conversational RCA without a SaaS dependency.
Metoro
Metoro correlates logs, metrics, traces, and Kubernetes events across multiple clusters to automate incident detection. It is aimed at teams managing scale where manual correlation across namespaces is impractical.
Coroot
Coroot focuses on application-level failure analysis with Kubernetes-native instrumentation. Performance and reliability engineers get anomaly detection and service-level insights without heavy configuration overhead.
CAST AI
CAST AI combines cluster cost optimization with observability-driven automation. If your team is also trying to right-size workloads, the cost-aware remediation suggestions alongside telemetry data make it a practical dual-purpose pick.
Qovery
Qovery ties deployment workflows to observability hooks, which is useful for development teams that want to correlate a bad deploy with a log spike without switching tools.
Falco and Falco Vanguard
Falco is the standard for Kubernetes runtime security. It surfaces suspicious behavior from syscall events and Kubernetes audit logs using community-maintained detection rules. Falco Vanguard extends those capabilities with additional rule sets. Security teams should treat Falco as a baseline, not an optional add-on.
Trivy and Trivy by Aqua Security
Trivy handles vulnerability scanning for containers and IaC, integrating into CI/CD pipelines and complementing log-based security triage. When an incident points to a known CVE in a running image, Trivy gives you the evidence chain from scan to runtime.
Logz.io
Logz.io’s embedded AI agent automates workflow-aware investigations, surfaces trends, and correlates telemetry to accelerate RCA. It is the strongest managed option for teams that want AI-assisted investigation without building the pipeline themselves.
Parseable
Parseable takes a parsing-first approach: it structures and normalizes logs before they reach any analysis layer. Garbage-in-garbage-out is the most common failure mode in AI log pipelines, and Parseable addresses it directly.
Grafana Loki
Loki is the cost-conscious choice for log storage in Kubernetes environments already running Grafana. It indexes only metadata, keeps storage costs low, and pairs naturally with Grafana dashboards and alerting.
Elasticsearch
Elasticsearch’s Streams feature maps unstructured logs to structured fields automatically, and its AI assistant generates queries from natural language and runs agentic investigations at petabyte scale. For teams with large, heterogeneous log volumes, it is the most capable ingestion-to-analysis platform in this list.
Datadog
Datadog makes sense for teams already using it for metrics and tracing. Adding log management gives you end-to-end telemetry in one place, with AI-assisted insights layered on top of existing dashboards.
SigNoz
SigNoz is the self-hosted observability stack for teams that want logs, metrics, and traces without a SaaS bill. It is cost-effective and gives you full control over data residency.
Fluent Bit
Fluent Bit is the de facto Kubernetes log forwarder. Its low overhead and native Kubernetes metadata enrichment make it the right first step in any AI log pipeline. Enriching logs with Kubernetes metadata before analysis is what lets an RCA agent map a failure to the correct pod, namespace, and deployment.
Vector
Vector handles high-throughput log, metric, and trace pipelines with strong transformation capabilities. For teams that need flexible routing and enrichment before logs hit a storage or analysis layer, Vector is faster and more configurable than most alternatives.
Streamlit (K8s log dashboards)
Streamlit is not an observability platform, but it is a practical tool for prototyping ML-driven log dashboards and internal investigative tools quickly. If your team wants a custom AI-powered view of log data without a full product build, a Streamlit app can get you there in a day.
Kubectl-ai
Kubectl-ai surfaces AI-driven hints and diagnostics directly in kubectl workflows. For operators who live in the terminal, it is the lowest-friction way to get AI-assisted cluster insights without switching context.
Lens Prism
Lens Prism adds AI-assisted diagnostics to the Lens cluster IDE. Teams that already use Lens for cluster visibility get embedded AI insights without adopting a new tool.
Headlamp AI
Headlamp AI offers browser-based cluster navigation with emerging AI features for troubleshooting. It suits teams that prefer a UI-first workflow over CLI-heavy approaches.
Botkube
Botkube routes Kubernetes alerts to Slack or Microsoft Teams and adds AI-assisted message summaries and threaded investigation support. For on-call teams that handle incidents in chat, it keeps the investigation in the channel where the conversation is already happening.
Aikido Security
Aikido Security focuses on detecting and triaging security-related log signals in Kubernetes workloads. It complements runtime detection tools like Falco with triage workflows tuned for security teams.
Pro Tip: Before evaluating any of these tools, run kubectl get events --sort-by=.lastTimestamp -A and check your current log volume per namespace. Tools like Loki and Parseable are sized very differently than Elasticsearch, and knowing your daily log GB will save you from a painful mid-POC pivot.
Side-by-side comparison of AI Kubernetes logging tools
The table below covers the key technical and procurement dimensions operators care about. Rows follow the shortlist order, with Devopsaitoolkit leading.
| Tool | Best for | Primary AI capability | Data sources | Deployment | Key integrations | Auto-remediation | Pricing signals |
|---|---|---|---|---|---|---|---|
| Devopsaitoolkit | Custom AI workflows and POC quickstarts | Prompt-driven RCA, workflow templates | Logs, k8s events (via integrations) | Self-hosted / hybrid | Fluent Bit, Prometheus, Grafana, OpenTelemetry | Runbook generation via prompts | Tiered; see pricing page |
| K8sGPT | Conversational cluster diagnostics | NL query, interactive RCA | Logs, k8s events | Self-hosted (in-cluster) | kubectl, Prometheus | Suggested fixes | Open source |
| Metoro | Multi-cluster incident detection | Automated correlation, anomaly detection | Logs, metrics, traces, k8s events | SaaS / hybrid | OpenTelemetry, Grafana | Incident summaries | Commercial |
| Coroot | App-level failure analysis | Anomaly detection, performance insights | Logs, metrics, traces | Self-hosted / SaaS | OpenTelemetry, Prometheus | Failure mode analysis | Open source + commercial |
| CAST AI | Cost optimization + observability | Cost-aware remediation suggestions | Logs, metrics, k8s events | SaaS | Prometheus, Grafana | Auto-scaling, cost actions | Commercial |
| Qovery | Deploy-to-observability integration | Deployment-correlated log analysis | Logs, k8s events | SaaS | Fluent Bit, Grafana | Deploy rollback hooks | Commercial |
| Falco / Falco Vanguard | Runtime security detection | Rule-based anomaly detection | Syscall events, k8s audit logs | Self-hosted | Falco Sidekick, Slack, SIEM | Alert-driven rules | Open source |
| Trivy / Trivy by Aqua Security | Shift-left vulnerability scanning | CVE correlation with runtime | Container images, IaC, logs | Self-hosted / SaaS | CI/CD pipelines, Kubernetes | Scan-triggered alerts | Open source + commercial |
| Logz.io | Managed AI-assisted RCA | Embedded AI agent, confidence scores | Logs, metrics, traces, k8s events | SaaS | Fluent Bit, Fluentd, OpenTelemetry, Grafana | AI-generated RCA with evidence | Commercial (managed) |
| Parseable | Log parsing and normalization | Parsing-first pipeline validation | Logs | Self-hosted | Fluent Bit, Vector | Pipeline validation | Open source + commercial |
| Grafana Loki | Cost-conscious log storage | Label-based query, alerting | Logs | Self-hosted / SaaS | Promtail, Fluent Bit, Grafana | Alert rules | Open source + commercial |
| Elasticsearch | Petabyte-scale ingestion + AI analysis | Agentic AI, NL query, anomaly detection | Logs, metrics, traces | Self-hosted / SaaS | Fluent Bit, Logstash, OpenTelemetry | AI-generated queries, investigations | Commercial (Elastic Cloud) |
| Datadog | Full-stack telemetry + log AI | AI-assisted insights, anomaly detection | Logs, metrics, traces, k8s events | SaaS | Fluent Bit, Fluentd, OpenTelemetry | Watchdog anomaly alerts | Commercial |
| SigNoz | Self-hosted open-source observability | Logs + metrics + traces correlation | Logs, metrics, traces | Self-hosted | OpenTelemetry, Fluent Bit | Alert-based | Open source + commercial |
| Fluent Bit | Kubernetes log forwarding + enrichment | Metadata enrichment, routing | Logs | Self-hosted (DaemonSet) | Loki, Elasticsearch, Datadog, OpenTelemetry | — | Open source |
| Vector | High-throughput observability pipeline | Transform, route, enrich | Logs, metrics, traces | Self-hosted | Loki, Elasticsearch, Datadog, Kafka | — | Open source |
| Streamlit (K8s dashboards) | Prototyping AI log dashboards | Custom ML/AI dashboard logic | Logs (via custom connectors) | Self-hosted | Custom | — | Open source |
| Kubectl-ai | CLI-based AI diagnostics | NL hints, cluster state queries | Logs, k8s events | Self-hosted (CLI plugin) | kubectl | Suggested commands | Open source |
| Lens Prism | GUI-based AI cluster exploration | Embedded AI diagnostics | Logs, k8s events | Desktop (Lens extension) | Lens, Prometheus | Diagnostic suggestions | Commercial |
| Headlamp AI | Browser-based AI cluster navigation | Contextual AI troubleshooting | Logs, k8s events | Self-hosted / SaaS | Kubernetes API | In-UI diagnostics | Open source + commercial |
| Botkube | ChatOps incident investigation | AI alert summaries, threaded RCA | Logs, k8s events | Self-hosted / SaaS | Slack, Teams, Prometheus, Grafana | Chat-driven runbook execution | Commercial |
| Aikido Security | Security log detection and triage | Security-centric anomaly detection | Logs, k8s events | SaaS | CI/CD, Kubernetes API | Triage workflows | Commercial |
Benchmark reference (sourced figures):
| Metric | Vendor / Tool | Reported value |
|---|---|---|
| MTTR reduction | LogClaw | Under 90 seconds vs. ~174 minutes manual |
| Search latency | LogPulse | Sub-200ms P95 across billions of log entries |
How does AI-powered Kubernetes log analysis actually work?
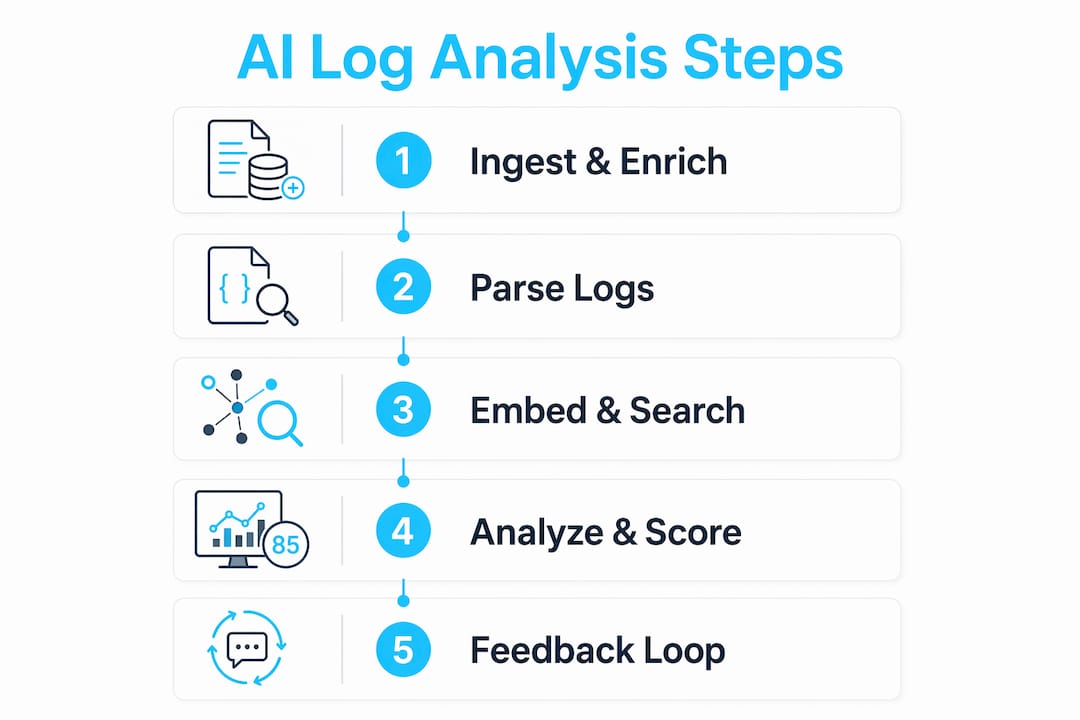
LLM-driven RCA produces reliable answers only when logs are structured and contextualized before they reach the model. The pipeline has five stages, and skipping any one of them is where most teams hit a wall.
1. Ingest and enrich
Fluent Bit or Vector runs as a DaemonSet, collects logs from every node, and attaches Kubernetes metadata: namespace, pod name, container name, labels, and node. Without this enrichment, an LLM cannot map a log line to the correct deployment. The kube-logging.dev documentation covers the metadata fields that matter most for accurate RCA mapping.
2. Parse and structure
Raw logs are noisy. Parseable, Elasticsearch Streams, or a Vector transform stage normalize them into structured fields before they reach any analysis layer. Sending unstructured text to an LLM wastes tokens and produces vague answers. Elasticsearch’s Streams feature handles this automatically for heterogeneous log formats at scale.
3. Embeddings and vector search
Structured log events are embedded into a vector index. When a new incident fires, the system retrieves semantically similar past incidents using vector search, giving the LLM relevant historical context without stuffing the entire log history into the prompt. This is what makes retrieval-augmented generation (RAG) practical for log analysis.
4. LLM-driven RCA and confidence scoring
The LLM receives a structured prompt: the triggering alert, enriched log context, correlated metrics and traces, and retrieved similar incidents. It generates a root-cause hypothesis, a confidence score, and suggested fix steps. Tools like Logz.io’s embedded AI agent automate this stage and surface evidence alongside the hypothesis so operators can verify rather than blindly trust the output.
5. Feedback loop
Operators confirm or reject the RCA output. Confirmed hypotheses update the vector index and refine future retrievals. This is the stage most teams skip, and it is why AI log analysis gets better over time in teams that invest in it and stays mediocre in teams that treat it as a one-time setup.
Pro Tip: LLM context window limits are the primary cost bottleneck. Aggregate statistics first (error rates, latency percentiles) and fetch full log traces only after an anomaly is flagged. This keeps token usage manageable and precision high.
MTTR signal: LogClaw reports MTTR under 90 seconds for AI-assisted investigation, compared with an industry benchmark of approximately 174 minutes for manual investigation workflows. That gap is the business case for structured AI log pipelines.
How to integrate AI tools into your Kubernetes logging pipeline
This is the part that actually takes time. The tools are the easy part; the pipeline is where teams get stuck.
Step-by-step implementation
- Instrument your cluster. Deploy Fluent Bit as a DaemonSet with the Kubernetes filter plugin enabled. This attaches namespace, pod, and label metadata to every log line automatically.
- Standardize log format. Adopt Elastic Common Schema (ECS) or OpenTelemetry log conventions across your workloads. Structured JSON logs with consistent field names are what let AI tools correlate events across services.
- Enrich and route. Use Fluent Bit or Vector to add Kubernetes metadata, apply parsing transforms, and route logs to your storage layer (Loki, Elasticsearch, or a managed platform like Logz.io or Datadog).
- Set up a vector index. For self-hosted RCA, deploy a vector database (pgvector, Weaviate, or Qdrant) and embed normalized log events. For managed options, Logz.io and Elasticsearch handle this internally.
- Deploy the RCA agent. Wire an LLM agent (KubeRCA, K8sGPT, or a custom workflow from Devopsaitoolkit) to your Alertmanager. When an alert fires, the agent collects context, queries the vector index, and generates an RCA summary. KubeRCA publishes LLM-generated summaries to Slack and a dashboard out of the box.
- Integrate with your ops channels. Route RCA outputs to Slack via Botkube or directly via webhook. Connect to Grafana for dashboard overlays and Alertmanager for threshold-based triggers.
- Validate results. Set a confidence threshold (e.g., only surface RCA outputs above 0.75 confidence). Run a two-week POC on a defined incident set and measure MTTR before and after.
Privacy and compliance checklist
- Self-hosted vs. SaaS: Security-conscious teams should deploy the LLM agent inside their VPC. This keeps log data on-premises and satisfies data-residency requirements without sacrificing RCA capability.
- PII masking: Apply a masking transform in Fluent Bit or Vector before logs leave the cluster. Redact user IDs, IP addresses, and session tokens at the pipeline level, not at the storage level.
- Anonymization: For teams subject to SOC 2 or HIPAA, document which fields are masked and where the masking occurs. Auditors want a pipeline diagram, not a verbal assurance.
- Model provider choice: If you use an external LLM (OpenAI, Anthropic), confirm that your data processing agreement covers log data. For maximum control, run a local model (Ollama, vLLM) inside the cluster.
Pro Tip: Use these MTTR-reduction prompts as a starting template for your RCA agent. They are structured for Kubernetes incident context and save you the first two iterations of prompt engineering.
How do you choose the right AI log-analysis tool for your team?
Start with your current stack, not the vendor’s feature list. The best tool is the one your team will actually use, integrated with the systems already generating alerts.
Evaluation criteria (prioritized)
- RCA accuracy: Can the tool map a log anomaly to a specific pod, deployment, or config change? Ask for a demo on a real incident from your environment.
- Alert-to-evidence mapping: Does the output show which log lines and metrics support the hypothesis, or just a conclusion? Explainability is non-negotiable for on-call engineers who need to act fast. The case for explainability is practical, not philosophical: operators who cannot verify an AI suggestion will ignore it.
- Integration depth: Does it connect to your existing Fluent Bit, Prometheus, and Grafana setup, or does it require a full pipeline replacement?
- Throughput and latency: What is the ingestion rate at your log volume? Ask for P95 search latency numbers, not averages.
- Data residency: Can it run fully self-hosted? If not, where does log data go and under what DPA?
- Cost model: Per-GB ingestion, per-seat, or flat rate? At scale, per-GB pricing can surprise you.
Vendor questions to ask in a POC
- What is the maximum supported ingestion rate, and how does performance degrade above it?
- Which LLM providers are supported, and can we bring our own model or run a local one?
- What explainability outputs does the RCA agent produce (confidence scores, evidence links, log line citations)?
- Does the platform support runbook generation or incident export for postmortem workflows?
- How is embedding storage managed, and what is the refresh cadence for the vector index?
- What PII masking or anonymization is applied before data reaches the LLM?
Red flags to watch for
- No confidence scores or evidence links in RCA outputs (opaque inference)
- No self-hosted deployment option for teams with data-residency requirements
- Full log data sent to an external LLM without masking
- No documented throughput limits or scaling architecture
- Vendor cannot demonstrate the tool on your log format during a POC
POC acceptance tests
- Feed a sample incident (e.g., a CrashLoopBackOff with OOMKilled exit code) and check whether the RCA output identifies the correct pod and root cause.
- Run a throughput test at 2x your average daily log volume and measure P95 query latency.
- Measure false-positive rate on a week of production alerts: how many AI-generated RCA summaries required significant correction?
- Verify that PII masking works end-to-end by injecting a test log line with a known user ID and confirming it does not appear in the LLM prompt.
Pro Tip: Ask every vendor for a sample incident response workflow specific to Kubernetes. If they cannot show you one, that tells you something about how production-ready the tool actually is.
What does the evidence say about AI for Kubernetes log analysis?
The strongest independent signal on AI log analysis comes from MTTR benchmarks and search performance data, not vendor marketing.
Key benchmark: LogClaw reports MTTR under 90 seconds for AI-assisted investigation, against an industry baseline of approximately 174 minutes for manual workflows. That is not a marginal improvement; it changes the economics of on-call rotations.
Search performance: LogPulse reports sub-200ms P95 search latency across billions of log entries using a ClickHouse-based architecture with a visual pipeline builder and production-ready templates.
Natural-language log querying lets engineers identify causes like DB connection pool exhaustion from large log corpuses without writing complex query syntax. That matters most during an active incident when cognitive load is already high.
The KubeRCA project demonstrates a practical open-source pattern: connect Alertmanager to an LLM agent, collect Kubernetes and observability context, and publish RCA summaries to Slack. The architecture is reproducible and auditable, which is what makes it useful as a POC reference rather than just a demo.
Hypothesis-driven diagnosis, where the AI proposes a ranked list of candidate causes with supporting evidence, consistently outperforms reactive log searching in real Kubernetes environments. The shift is cultural as much as technical: operators need to trust the hypothesis enough to act on it, which is why confidence scores and evidence traceability are the features that matter most in production.
Measuring ROI in a POC:
- Baseline MTTR: measure on 20–30 incidents before AI tooling is active
- Incident sample: use a mix of CrashLoopBackOff, OOMKilled, and network-policy failures
- Measurement window: two weeks minimum, four weeks preferred
- Signal: track false-positive rate alongside MTTR; a tool that halves MTTR but doubles false positives is not an improvement
For a structured approach to measuring MTTR improvements, Devopsaitoolkit’s AI MTTR guide covers the cost drivers and measurement framework in detail.
Key Takeaways
AI-powered Kubernetes log analysis delivers the fastest MTTR gains when you combine structured log ingest, Kubernetes metadata enrichment, and an LLM-backed RCA agent with confidence scoring and evidence traceability.
| Point | Details |
|---|---|
| Structure logs first | Normalize to ECS or OpenTelemetry conventions before any AI analysis; garbage-in produces useless RCA outputs. |
| Enrich with k8s metadata | Deploy Fluent Bit or Vector with Kubernetes metadata enrichment so RCA agents can map failures to the correct pod and namespace. |
| MTTR benchmark | LogClaw reports MTTR under 90 seconds for AI-assisted investigation, versus an industry baseline of approximately 174 minutes for manual workflows; use this as your POC baseline target. |
| Self-host for privacy | Deploy the LLM agent inside your VPC and apply PII masking at the pipeline level to meet data-residency and compliance requirements. |
| Devopsaitoolkit | Provides prompt libraries, AI workflow templates, and Kubernetes-specific quickstarts for teams building a custom, auditable RCA workflow. |
An experienced operator’s take on AI in Kubernetes incident workflows
The first time I wired an LLM agent to Alertmanager, the output was genuinely useful about 60% of the time. The other 40% was either too vague to act on or confidently wrong about which service was the root cause. That ratio improved significantly once we fixed the upstream problem: logs were inconsistently structured, and the Kubernetes metadata enrichment was incomplete. The AI was not the bottleneck; the pipeline was.
What actually changed our on-call experience was treating RCA outputs as a first hypothesis, not a verdict. Operators stopped spending the first 10 minutes of an incident grepping through logs and started spending it verifying or disproving a specific hypothesis. That is a different cognitive mode, and it is faster even when the AI is wrong. The runbooks we wrote to document confirmed RCA patterns became the most valuable artifact of the whole exercise, because they fed back into the vector index and made future retrievals more accurate.
The organizational change that surprised me most was runbook authorship. Engineers who had never written a runbook started writing them because the AI gave them a draft to edit rather than a blank page to fill. That is a real cultural shift, and it compounds over time. Keep humans in the loop, require confidence scores before acting on any AI suggestion, and measure signal-to-noise improvements on a monthly cadence. The teams that do this consistently see the tool get better. The teams that set it up and walk away do not.
Devopsaitoolkit gives you a faster path to a production-ready AI log workflow
Most teams spend weeks building the prompt engineering and workflow scaffolding that Devopsaitoolkit ships as a starting point. The toolkit gives you pre-built prompt libraries tuned for Kubernetes incident triage, AI workflow templates for RCA and postmortem generation, and integration guidance for connecting to your existing Prometheus, Grafana, and Fluent Bit stack.
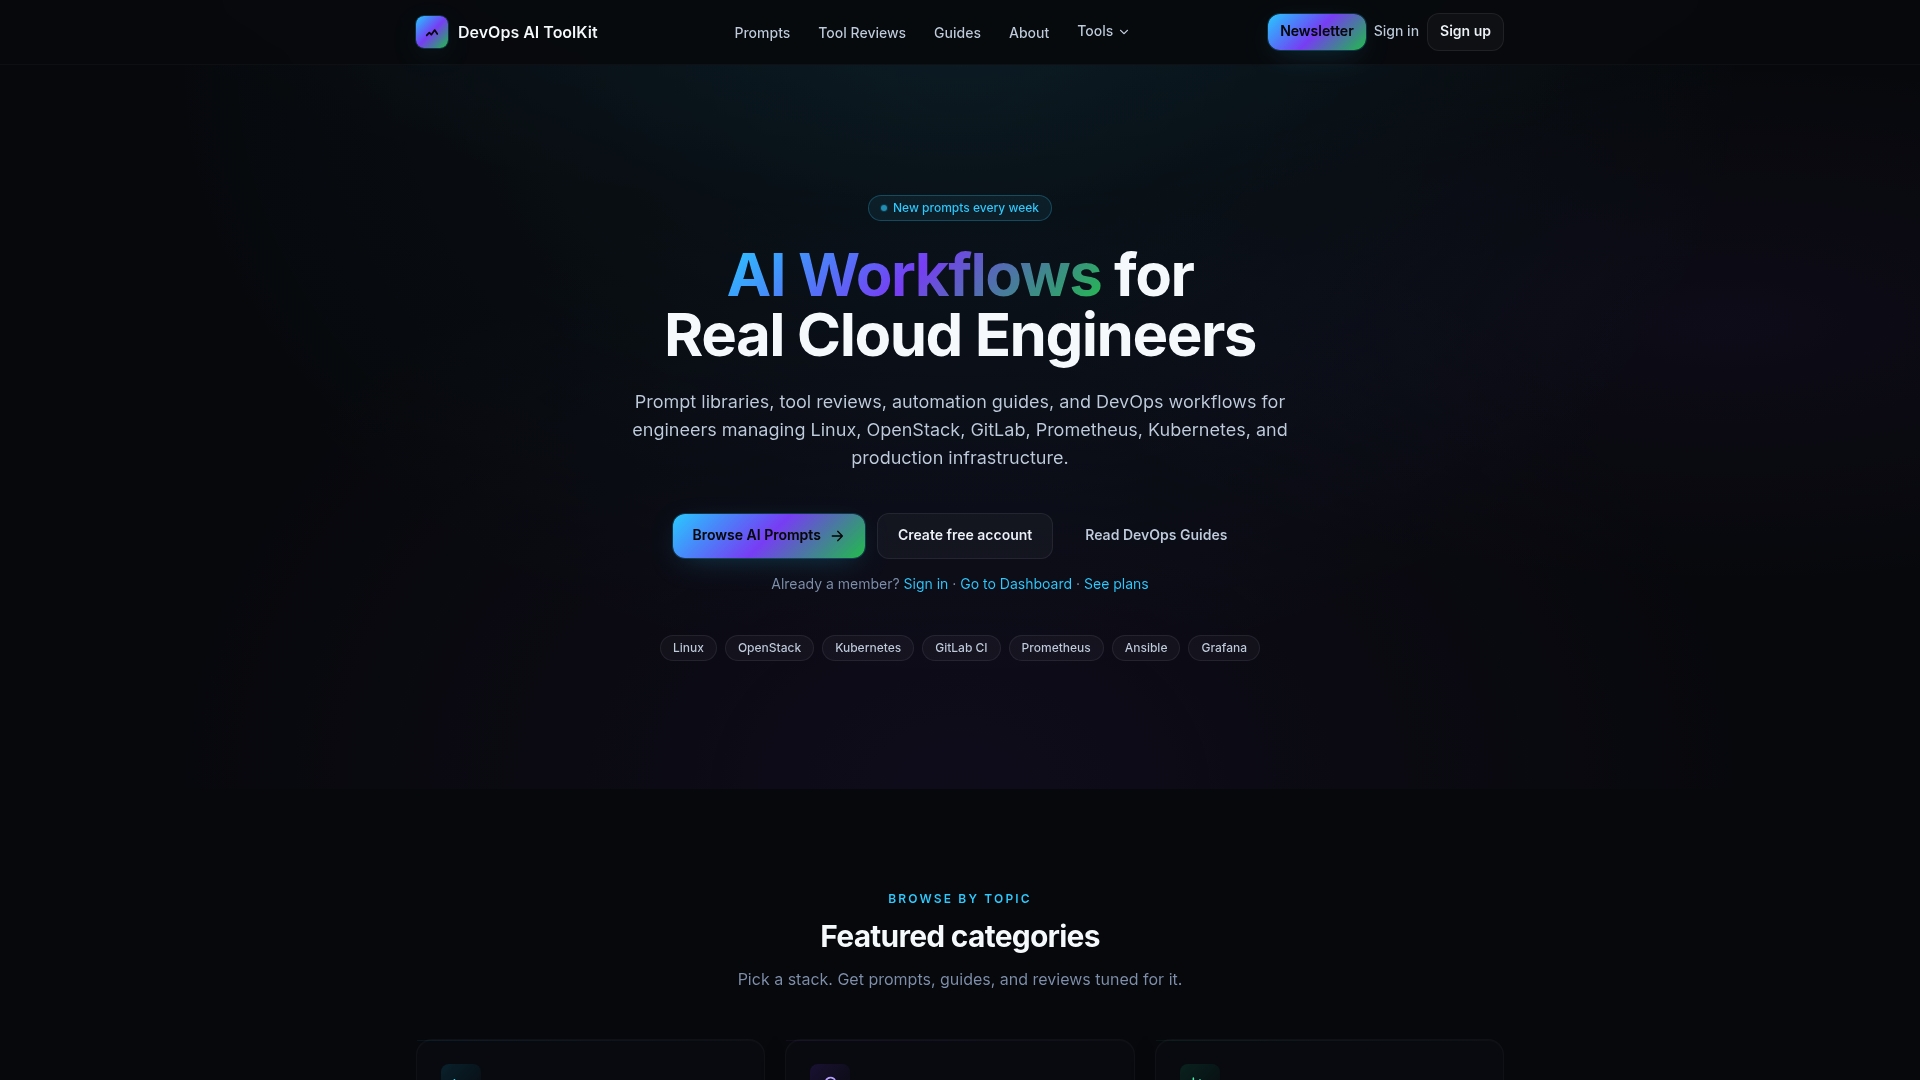
For teams that want a secure, self-hosted RCA workflow, the quickstart covers local embedding setup, configured prompt templates for CrashLoopBackOff and OOMKilled scenarios, and a two-week POC framework with MTTR measurement built in. You are not starting from zero; you are starting from a working pattern that other cloud engineers have already validated.
Check the pricing page to see which plan fits your team’s scale, or browse the AI DevOps tools catalog to see the full set of workflows and integrations available. If you want to go deeper on incident response prompts first, the 133-prompt incident response library is free to use today.
Useful sources and vendor docs to read next
These are the primary sources and vendor docs worth bookmarking for a POC proposal or architecture review.
- KubeRCA (GitHub): Sample manifests and the full open-source RCA workflow connecting Alertmanager to an LLM agent. Start here if you want a self-hosted, auditable RCA pipeline.
- Logz.io AI observability: Documentation for the embedded AI agent, workflow-aware investigations, and telemetry correlation. Useful for teams evaluating managed platforms.
- Elastic observability / Streams: Covers the Streams feature for automatic log structuring, the AI assistant, and NL query generation. Reference this in a POC proposal for large-scale ingestion.
- LogPulse: Sub-200ms search latency benchmarks and visual pipeline builder documentation. Useful for teams with strict query-latency SLOs.
- kube-logging.dev documentation: The authoritative reference for Fluent Bit Kubernetes metadata enrichment, including the specific fields that matter for accurate RCA mapping.
- LogClaw: MTTR benchmark data and AI-assisted investigation workflow documentation. Cite this in a POC proposal when making the business case for AI log tooling.
- Falco.org: Official Falco documentation, detection rule library, and Falco Vanguard extension guides. The baseline reference for Kubernetes runtime security detection.
- LogBrain: Natural-language log querying documentation and use-case examples, including DB connection pool exhaustion detection from large log corpuses.
- Devopsaitoolkit blog: Guides on AI workflows, Kubernetes troubleshooting, and incident response prompts. The most practical starting point for teams building their own AI-assisted log analysis workflow.
Recommended
- Triaging Kubernetes Pod Logs at Scale With AI
- AI-Assisted Kubernetes Troubleshooting Explained
- AI Workflows for Kubernetes Cluster Troubleshooting
- The Best AI Tools for DevOps Engineers in 2026 — DevOps AI ToolKit
Get 500 Battle-Tested DevOps AI Prompts — Free
500 battle-tested, copy-paste AI prompts engineered by a senior systems engineer — every one with fill-in placeholders and safety/back-out notes. Drop your email and it's yours.
- 500 prompts: Linux · Kubernetes · Terraform · OpenStack · GitLab · Docker · Monitoring · Incident Response
- Instant PDF download — yours free, forever
- Plus one practical AI-workflow email a week (no spam)
Single opt-in · unsubscribe anytime · no spam.