AI-Assisted Kubernetes Troubleshooting Explained
How AI-assisted Kubernetes troubleshooting works — K8sGPT, kubectl-why, and kubectl debug for faster root-cause analysis, with the governance to run it safely in production.
- #kubernetes
- #troubleshooting
- #k8sgpt
- #ai
- #sre
- #debugging

AI-assisted Kubernetes troubleshooting is the practice of combining deterministic cluster data collection with AI-powered analysis to produce human-readable diagnoses and remediation suggestions. Tools like K8sGPT, kubectl-why, and kubectl-ai represent the current state of this approach, each targeting a different layer of the debugging workflow. The result is faster root cause identification, cleaner incident timelines, and less time staring at a wall of logs hoping something jumps out. This guide covers how these tools work, how to deploy them safely, and how to build governance around them in production clusters.
How AI-assisted Kubernetes troubleshooting actually works
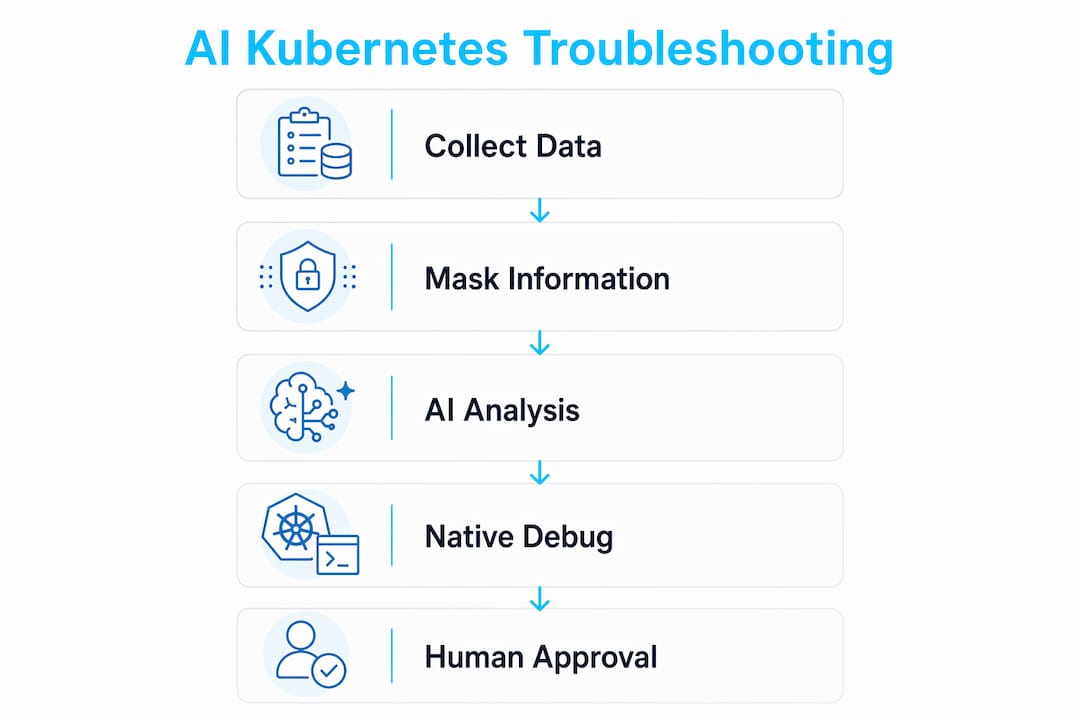
The architecture behind AI-assisted Kubernetes troubleshooting is a two-layer system. The first layer is deterministic. A local rule engine collects pod states, events, logs, and service-to-endpoint relationships. It does not guess. It reads the cluster state exactly as Kubernetes reports it.
The second layer is where AI enters. AI troubleshooting agents send only masked, focused evidence to the AI backend, not raw log dumps. The AI then generates a natural-language explanation of the fault, a probable root cause, and a set of next-step commands you can run to verify or fix the issue. This separation matters because it keeps sensitive cluster data out of AI prompts while still producing useful output.

K8sGPT is the most widely adopted tool in this space. Running k8sgpt analyze --explain sends anonymized cluster analysis to a configured AI backend and returns a plain-English diagnosis. The anonymization layer masks object names and labels before transmission. That said, there is a known gap: events data is not always masked, which is a real caution for production clusters handling sensitive workloads.
kubectl-why takes a narrower approach. It collects status and event data for a specific pod and renders a plain-English diagnosis covering patterns like OOMKilled, ImagePullBackOff, and CrashLoopBackOff. The output includes not just the diagnosis but the next-step commands to verify the issue. That combination of explanation plus verification command is what separates these tools from a basic kubectl describe.
Pro Tip: Run k8sgpt analyze --explain --filter=Pod to scope the AI analysis to pod failures only. This reduces noise and keeps the AI context focused, which produces sharper diagnoses.
The key insight here is that the AI layer does not replace the deterministic checks. It interprets them. You get the precision of Kubernetes-native data collection with the readability of a senior engineer explaining the problem out loud.
Kubernetes-native debugging primitives that complement AI guidance
AI tools tell you what is wrong. Native Kubernetes debugging tools let you verify it without breaking anything. The two work best together.
kubectl debug is the primary native primitive for this workflow. It creates ephemeral debugging containers or copies a pod into a new debug session, letting you attach to a running workload interactively. The key advantage is that it does not restart the original pod. You validate the AI’s diagnosis against a live environment without disrupting production traffic.
Here is a practical sequence for combining AI guidance with kubectl debug:
- Run
k8sgpt analyze --explainto get the AI diagnosis and suggested checks. - Identify the failing pod from the output, for example
mypodin namespaceproduction. - Run
kubectl debug mypod -it --image=busybox --copy-to=mypod-debugto create a debug copy. - Execute the verification commands the AI suggested, such as checking DNS resolution, network connectivity, or filesystem permissions.
- Confirm or rule out the AI’s root cause based on what you observe in the debug session.
- Apply the fix to the original workload once the cause is confirmed.
This workflow matters because AI models can hallucinate. The in-cluster debug container design means you always have a safe, non-destructive way to validate before you act. Treat the AI output as a strong hypothesis, not a confirmed diagnosis.
Pro Tip: Use kubectl debug node/<node-name> -it --image=busybox to attach to a node directly when the AI flags node-level resource pressure or kernel issues. This gives you host-level visibility without SSH access.
Combining AI-generated fault domains with ephemeral debug containers is the fastest path from alert to confirmed fix. The AI narrows the search space. The debug container lets you prove it.
CLI vs. operator mode: which deployment model fits your cluster?
AI troubleshooting tools ship in two operational models. Choosing the right one depends on your cluster size, team workflow, and how much automation you want.
| Feature | CLI Mode | Operator Mode |
|---|---|---|
| Trigger | On-demand, manual | Continuous, automated |
| Scan interval | Per command run | Default 30 seconds |
| Best for | Ad-hoc debugging, CI pipelines | Production monitoring, alerting |
| Resource overhead | Low, runs externally | Moderate, runs inside cluster |
| Output destination | Terminal | Kubernetes events, Slack, PagerDuty |
| Analyzer scope | Configurable per run | Configurable per operator spec |
CLI mode is the right starting point. You run k8sgpt analyze when you need it, review the output, and move on. There is no persistent footprint in the cluster. This is ideal for debugging specific incidents or running checks as part of a deployment pipeline.
Operator mode is the production-grade choice. The K8sGPT operator runs inside the cluster and continuously scans for issues across Pod, Deployment, Service, and Node analyzers. It surfaces findings as Kubernetes events or pushes them to external notification channels. The 30-second default interval means you catch regressions fast.
A few operational considerations worth noting:
- Operator mode increases API server query load. Tune the scan interval based on cluster size.
- Both modes support analyzer filters. Use them to avoid noise from expected states like pending init containers during rollouts.
- kubectl-ai adds a third model via Model Context Protocol, which lets AI models call real Kubernetes tool APIs instead of processing raw log dumps. This reduces token costs and hallucination risk significantly.
Start with CLI mode to build familiarity. Graduate to operator mode when you want continuous coverage and automated alerting.
How to manage security and governance for AI troubleshooting tools
Security for AI-assisted Kubernetes troubleshooting is not primarily an AI problem. It is a Kubernetes permissions problem. The threat model shifts to focus on what Kubernetes commands the AI agent can execute and what cluster data it can read, not on the AI model itself.
The governance checklist for production deployments covers several critical areas:
- RBAC scoping: Grant AI tools the minimum permissions needed. Read access to pods, events, and logs is usually sufficient for diagnosis. Write access for automated remediation requires explicit justification and circuit breakers.
- Anonymization verification: Confirm which fields your tool masks before sending data to an external AI backend. K8sGPT masks object names and labels, but events data gaps remain a real exposure risk.
- Stopping conditions: Production AI agents must have explicit circuit breakers. Define confidence thresholds below which the agent falls back to deterministic output and pages a human. Infinite AI retry loops in a degraded cluster make incidents worse.
- Provider unavailability handling: If the AI backend is unreachable, the tool should fail gracefully and still surface the raw deterministic analysis. Never let AI unavailability block your ability to read cluster state.
- Human-in-the-loop remediation: Automated fixes should require explicit approval in production. Use AI for diagnosis and suggestion. Keep humans in the execution path for anything that modifies workloads.
Pro Tip: Audit your AI tool’s RBAC bindings the same way you audit any other service account. Run kubectl auth can-i --list --as=system:serviceaccount:<namespace>:<sa-name> to see exactly what the tool can do in your cluster.
Reviewing your Kubernetes RBAC and security posture before deploying any AI troubleshooting tool is not optional. The AI layer is only as safe as the permissions you grant it.
Practical workflows and tools that optimize AI-driven debugging
A repeatable workflow is what separates teams that get value from AI troubleshooting tools from teams that run them once and forget about them. Here is the integration sequence that works in practice:
- Scan: Run
k8sgpt analyze --explainor deploy the operator for continuous scanning. - Triage: Review AI-generated diagnoses ranked by severity. Focus on CrashLoopBackOff, ImagePullBackOff, and OOMKilled first.
- Reconstruct: Use a timeline reconstruction tool like kubectl-timeline to build a chronological, deduplicated event narrative from the cluster state. This surfaces the sequence of failures without requiring agent installation.
- Validate: Use
kubectl debugto confirm the AI’s root cause in a non-destructive debug session. - Remediate: Apply the fix. For complex incidents, use AI-assisted triage workflows to reconstruct the incident timeline and document the resolution.
The tool comparison below covers the main options available in 2026:
| Tool | Primary Function | Deployment Mode | AI Backend |
|---|---|---|---|
| K8sGPT | Full cluster analysis with explanations | CLI and Operator | OpenAI, Ollama, others |
| kubectl-why | Per-pod plain-English diagnosis | CLI only | None (rule-based) |
| kubectl-ai | AI-driven kubectl command execution | CLI with MCP | Multiple providers |
| kubectl-timeline | Incident timeline reconstruction | CLI only | None (deterministic) |
kubectl-why is the right tool when you want fast, offline diagnosis for a single pod. kubectl-timeline is the right tool when you need to understand the sequence of events that led to a failure. K8sGPT covers the broadest surface area. kubectl-ai is the right choice when you want an AI model to execute kubectl commands on your behalf through a governed interface.
Select tools based on your team’s comfort with AI-generated output and your cluster’s complexity. Start with kubectl-why for targeted debugging. Add K8sGPT when you want cluster-wide coverage and natural-language explanations.
Key takeaways
AI-assisted Kubernetes troubleshooting delivers the most value when deterministic data collection, AI explanation layers, and native debugging primitives work together under firm governance controls.
| Point | Details |
|---|---|
| Two-layer architecture | Deterministic checks collect cluster evidence; AI interprets it into human-readable diagnoses. |
| Native tool integration | Use kubectl debug ephemeral containers to validate AI diagnoses without restarting production pods. |
| Deployment model choice | CLI mode suits ad-hoc debugging; operator mode with 30-second intervals suits continuous production monitoring. |
| Governance is non-negotiable | Scope RBAC tightly, verify anonymization gaps, and define stopping conditions before deploying AI agents. |
| Tool selection by use case | K8sGPT for cluster-wide analysis, kubectl-why for per-pod diagnosis, kubectl-timeline for incident reconstruction. |
Where AI troubleshooting earns its keep (and where it doesn’t)
I have spent enough time in degraded clusters at odd hours to have a clear opinion on this. AI explanation layers genuinely reduce the cognitive load of reading a wall of events and logs when you are already tired and under pressure. K8sGPT’s natural-language output has, more than once, pointed me toward a misconfigured liveness probe or a missing toleration faster than I would have found it manually. That is real value.
Where I get cautious is automated remediation. The governance controls around stopping conditions and RBAC scoping are not theoretical concerns. I have seen well-intentioned automation make a partial outage worse by retrying a broken fix in a loop. The incident response discipline that works at 3 AM is the same one that works with AI tools: read the state, form a hypothesis, validate before you act.
The anonymization gaps in events data are also worth taking seriously. Before you point K8sGPT at a cluster handling regulated data, verify exactly what gets masked. The tool’s documentation is honest about the limitation, but it is easy to miss in a fast setup.
My overall read: AI troubleshooting tools are now mature enough to use in production, but they work best as a diagnostic accelerator, not an autonomous operator. Pair them with Kubernetes manifest auditing and solid RBAC hygiene, and you have a genuinely faster debugging workflow.
— James
Build your AI troubleshooting workflow with DevOps AI ToolKit
DevOps AI ToolKit publishes prompt libraries and automation guides built specifically for engineers running production Kubernetes clusters. If you are integrating K8sGPT or kubectl-ai into your workflow, the Bash Leveled Logging Library prompt gives you structured logging output that pairs cleanly with AI log analysis, making it easier to feed well-formatted evidence into your troubleshooting pipeline. The Bash Dependency Preflight Check prompt helps you verify that all required tools are present before automation scripts run, reducing a common class of failures that AI tools then have to diagnose.
Browse the full AI prompt library for DevOps engineers to find prompts covering Kubernetes, Prometheus, GitLab, and production automation workflows.
FAQ
What is AI-assisted Kubernetes troubleshooting?
AI-assisted Kubernetes troubleshooting combines deterministic cluster data collection with AI analysis to produce plain-English diagnoses and remediation suggestions. Tools like K8sGPT and kubectl-why are the primary implementations of this approach.
How does K8sGPT anonymize cluster data?
K8sGPT masks object names and labels before sending data to the AI backend using its --explain flag. Events data is not always fully masked, so verify your anonymization coverage before using it with sensitive workloads.
Can AI tools fix Kubernetes issues automatically?
Some tools support automated remediation, but production best practice requires human approval before any workload modification. Use AI for diagnosis and suggestion, and keep humans in the execution path for changes.
How does kubectl debug complement AI troubleshooting?
kubectl debug creates ephemeral containers or pod copies that let you validate an AI-generated diagnosis interactively without restarting the original workload. This makes it the safest way to confirm a root cause before applying a fix.
What is the difference between K8sGPT CLI and operator mode?
CLI mode runs on-demand scans from your terminal with no persistent cluster footprint. Operator mode runs inside the cluster and scans continuously at a configurable interval, defaulting to every 30 seconds, making it suited for production monitoring and automated alerting.